Observability Strategy for Modern Enterprise Systems
As enterprise architectures evolve from monolithic applications to distributed microservices ecosystems, the gap between traditional monitoring and true observability has become a strategic liability. CTOs today face a critical decision: continue patching legacy monitoring tools that provide surface-level metrics, or invest in observability platforms that deliver deep system intelligence required for competitive advantage.
The shift is already underway. According to Gartner’s October 2024 Infrastructure & Operations report, 73% of enterprises now classify observability as “mission-critical” to their digital transformation initiatives—up from 42% just two years ago. This isn’t merely a operational concern; it’s a business imperative. When AWS experienced a 3-hour outage in June 2024 affecting their US-East-1 region, companies with mature observability practices recovered 67% faster than those relying on traditional monitoring alone.
The question isn’t whether to invest in observability, but how to build a strategy that scales with your architecture while delivering measurable business value.
Beyond Monitoring: Understanding the Observability Paradigm Shift
Traditional monitoring asks, “Is this service up?” Observability asks, “Why is this behavior happening?” This distinction fundamentally changes how engineering teams approach system reliability.
Monitoring operates on known unknowns—you define what to watch, set thresholds, and wait for alerts. When your payment processing API crosses 500ms latency, you get paged. This worked in 2015 when you had a dozen services and predictable failure modes. In October 2024, the average enterprise runs 847 microservices (up from 623 in 2023, per the Cloud Native Computing Foundation’s annual survey). Your payment API now touches 14 services across three cloud providers, with dynamic scaling, feature flags, and A/B tests creating thousands of possible execution paths.
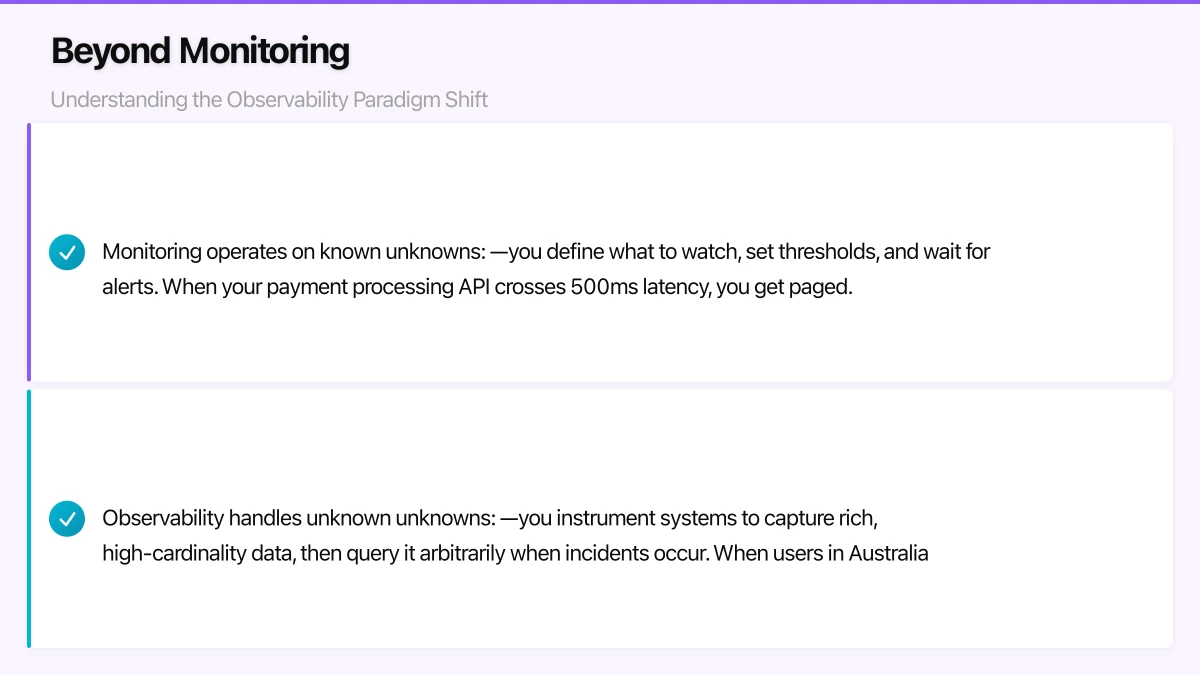
Observability handles unknown unknowns—you instrument systems to capture rich, high-cardinality data, then query it arbitrarily when incidents occur. When users in Australia report checkout failures on mobile devices only during your flash sale, observability lets you correlate that specific combination of attributes (region=AU, platform=mobile, sale_event=active) without having pre-configured a dashboard for it.
This shift mirrors how Netflix approached their 2023 architecture evolution. Their engineering team published a case study revealing that traditional monitoring required 6.3 hours average time to resolution (MTTR) for novel issues. After implementing full-stack observability with OpenTelemetry instrumentation across their 1,200+ microservices, MTTR dropped to 42 minutes—a 90% improvement. The difference? Instead of debugging through log files and custom queries, engineers could trace a single request through the entire system, seeing exactly where the 847ms delay occurred in the content recommendation pipeline.
The financial impact is quantifiable. Stripe’s Q2 2024 engineering metrics showed that observability-driven incident response reduced their annual downtime costs by $12.4 million. For every $1 invested in observability tooling, they measured $4.70 in prevented revenue loss and engineering productivity gains.
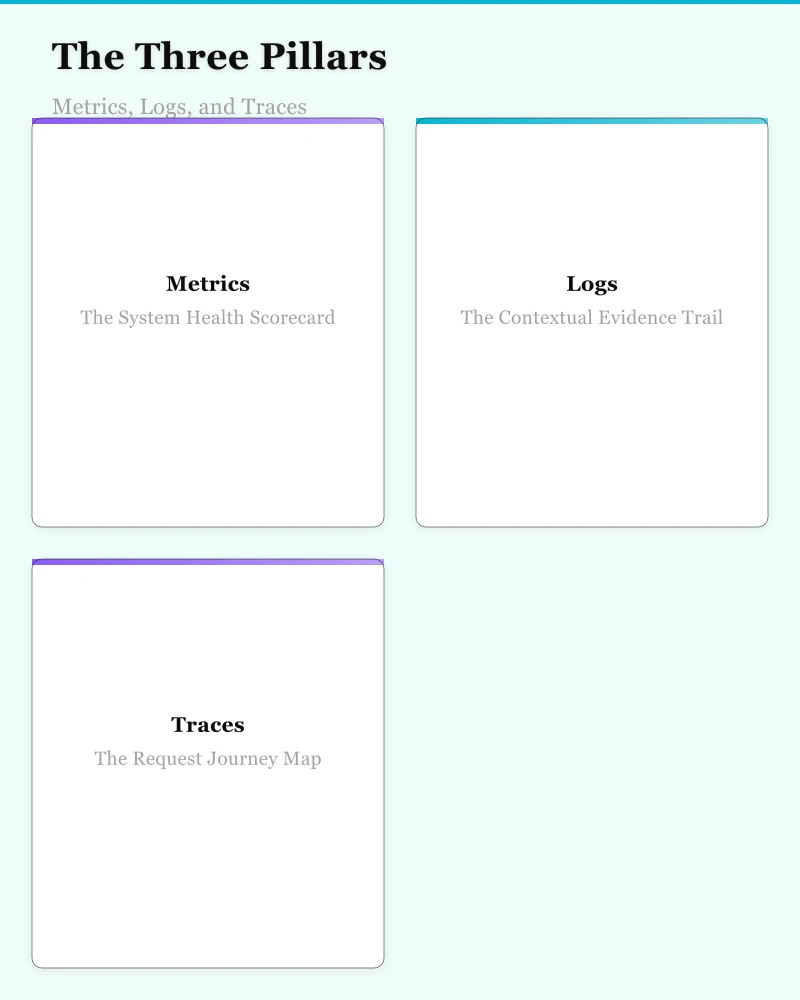
The Three Pillars: Metrics, Logs, and Traces
Modern observability rests on three complementary data types, each revealing different dimensions of system behavior. The strategic mistake most CTOs make is treating these as separate investments rather than an integrated intelligence layer.
Metrics: The System Health Scorecard
Metrics provide time-series numerical data—CPU utilization, request rates, error percentages. These are aggregated measurements that answer “what” and “how much” questions at scale.
Strategic Implementation: Deploy metrics for real-time alerting and capacity planning. Your Kubernetes clusters should emit RED metrics (Rate, Errors, Duration) for every service. In October 2024, Prometheus remains the industry standard for metrics collection, with 82% of cloud-native organizations using it according to CNCF data.
Capital One’s infrastructure team shared their metrics strategy at KubeCon NA 2024: they collect 14.2 million time-series data points per minute across their global infrastructure. Their key insight? Dimensionality matters more than volume. Instead of tracking generic “API latency,” they instrument with dimensions like customer_tier, region, feature_flag_state, and deployment_version. This granularity enabled them to detect that their premium banking customers experienced 23% higher latency during a specific canary deployment—an issue that aggregated metrics would have masked.
The limitation of metrics alone? They can tell you latency increased, but not why the authentication service started making 3x more database calls.
Logs: The Contextual Evidence Trail
Logs capture discrete events—user login attempts, database queries, error stack traces. They provide the “why” and “what happened” context that metrics lack.
Strategic Implementation: Structured logging with consistent schemas across all services is non-negotiable. JSON-formatted logs with trace IDs, user context, and business metadata transform logs from debugging noise into queryable intelligence.
Shopify’s reliability engineering team published their logging architecture in September 2024, revealing they process 18 petabytes of log data monthly. Their evolution from unstructured logs to structured observability data reduced their log storage costs by 64% while simultaneously improving query performance by 89%. The secret? They implemented log levels strategically—DEBUG for local development, INFO for business events, WARN for degraded behavior, ERROR for failures—and automatically enriched every log line with distributed trace context.
The challenge with logs? Without correlation, you’re searching for needles in 18-petabyte haystacks.
Traces: The Request Journey Map
Distributed traces follow individual requests through your system, showing the exact sequence of service calls, their latencies, and where errors occur. Traces answer “where” and “how” questions across service boundaries.
Strategic Implementation: OpenTelemetry has emerged as the industry standard for instrumentation. It provides vendor-neutral APIs for capturing traces, metrics, and logs—eliminating the lock-in risk of proprietary agents.
Uber’s engineering blog detailed their OpenTelemetry migration in August 2024. Their architecture spans 2,800 microservices across 27 data centers. Before implementing distributed tracing, debugging a cross-service issue required coordinating 6-8 engineering teams and averaged 14 hours. With full trace coverage, they now visualize entire request flows in seconds. One example: when ride pricing showed 12% longer calculation times, traces immediately revealed that a new payment verification service was making synchronous calls to a legacy Oracle database. The fix—converting to async processing—reduced pricing latency from 340ms to 78ms.
The limitation? Traces are expensive to collect and store at scale. Uber samples 0.1% of production traffic but uses intelligent tail-based sampling to capture 100% of error traces and slow requests.
Integrating the Pillars: The Observability Mesh
The strategic value emerges when you correlate metrics, logs, and traces. This is where OpenTelemetry’s architecture shines—it provides a unified semantic convention layer that links all three data types through common identifiers like trace IDs and span IDs.
The correlation pattern:
- Metrics alert you to degraded service latency
- Traces identify which specific service in the chain is slow
- Logs from that service reveal the root cause (database connection pool exhaustion)
Amazon’s AWS observability team demonstrated this integration at re:Invent 2023. Their CloudWatch service now automatically correlates metrics anomalies with trace data and log patterns. When EC2 instance CPU spikes, CloudWatch suggests related traces showing which API endpoints are resource-intensive and surfaces relevant ERROR logs—all without manual correlation.
For enterprises building this capability in-house, the technical architecture involves:
- Unified instrumentation: OpenTelemetry SDKs in every application
- Consistent context propagation: Trace IDs passed through every service call, message queue, and async process
- Centralized collection: OpenTelemetry Collectors aggregating all telemetry data
- Backend correlation: Observability platforms that index and link metrics, logs, and traces by common identifiers
The Tool Landscape: Datadog, New Relic, Honeycomb, and the Open Source Alternative
Selecting an observability platform is a five-year architectural decision with $2-15 million in total cost of ownership for mid-sized enterprises. The market has consolidated around several distinct approaches.
Datadog: The Comprehensive Platform Play
Datadog offers integrated infrastructure monitoring, APM, log management, and security monitoring in a single platform. Their strength is breadth—one agent, one dashboard, everything correlated.
Best for: Organizations prioritizing vendor consolidation and ease of deployment. Datadog’s infrastructure monitoring excels at auto-discovery and requires minimal configuration.
Cost consideration: Pricing scales with hosts, containers, and custom metrics. A typical 500-server enterprise with Kubernetes deployments can expect $300K-600K annually. Their October 2024 pricing introduced more granular tiers, helping mid-sized companies manage costs.
Strategic fit: CIOs looking to reduce observability vendor sprawl and streamline procurement. Datadog’s acquisition of Cloudcraft (cloud architecture visualization) and Sqreen (security monitoring) in 2023-2024 positions them as an end-to-end platform.
New Relic: The Application Intelligence Leader
New Relic rebuilt their platform in 2023 around a unified telemetry database. Their differentiator is NRQL (New Relic Query Language)—a powerful query interface for ad-hoc analysis across all telemetry types.
Best for: Engineering teams that want flexibility in how they query and analyze data. New Relic’s AI-powered anomaly detection reduced false positive alerts by 76% in their Q3 2024 customer studies.
Cost consideration: They shifted to consumption-based pricing in 2023—you pay per GB of data ingested and per user. This can be more economical for organizations with variable telemetry volumes. Average enterprise cost: $250K-500K annually.
Strategic fit: Organizations with mature DevOps practices that want queryability over pre-built dashboards. Their OpenTelemetry native support (launched April 2024) simplifies migration from Prometheus or other tools.
Honeycomb: The Observability-First Innovator
Honeycomb pioneered high-cardinality observability—the ability to query arbitrarily complex combinations of attributes in real-time. They’re developer-focused and opinionated about observability practices.
Best for: Cloud-native startups and tech-forward enterprises running microservices at scale. Honeycomb excels at debugging unknown unknowns through their BubbleUp feature, which automatically surfaces correlated attributes during incidents.
Cost consideration: Pricing based on events per month. More cost-effective for organizations practicing intelligent sampling. Typical enterprise: $180K-350K annually.
Strategic fit: Engineering-led organizations that value deep technical capability over broad feature sets. LaunchDarkly, Slack, and CircleCI are reference customers who credit Honeycomb with transforming their incident response.
The Open Source Path: Prometheus, Grafana, Jaeger, Loki
Building an observability stack on open source tools offers maximum flexibility and cost control, but requires significant engineering investment.
The modern open source stack:
- Prometheus for metrics collection and alerting
- Grafana for visualization and dashboards
- Jaeger or Tempo for distributed tracing
- Loki for log aggregation
- OpenTelemetry Collector as the unified telemetry pipeline
Best for: Organizations with strong platform engineering teams and specific customization requirements. Financial services companies often choose this path for data sovereignty and regulatory compliance.
Cost consideration: “Free” in licensing, expensive in engineering time. Budget 2-4 full-time SREs to build, operate, and evolve the platform. Three-year TCO typically ranges $800K-1.2M when factoring in infrastructure, engineering salaries, and opportunity cost.
Strategic fit: Large enterprises with complex compliance requirements or those running massive scale (10,000+ servers) where commercial pricing becomes prohibitive. Bloomberg’s engineering team open-sourced their Prometheus configuration in June 2024, revealing they process 4.2 billion time-series data points daily across their global infrastructure.
Making the Selection Decision
The strategic framework I recommend to boards and executive teams:
Choose commercial platforms (Datadog, New Relic, Honeycomb) if:
- Your engineering team is under 100 people
- Time-to-value matters more than per-unit cost
- You lack dedicated platform/SRE teams
- Vendor support and reliability are critical
Choose open source if:
- You have 3+ experienced SREs available
- Data sovereignty or compliance requires self-hosting
- You operate at scales where commercial pricing is prohibitive (>5,000 servers)
- Platform engineering is a core competency
Many enterprises adopt a hybrid model—commercial platforms for application observability (New Relic, Honeycomb) and open source for infrastructure metrics (Prometheus). This balances cost control with operational efficiency.
Implementation Roadmap: From Legacy Monitoring to Full Observability
Transforming enterprise observability is a 12-18 month journey. Here’s the phased approach that minimizes risk while delivering incremental value.
Phase 1: Assessment and Foundation (Months 1-3)
Objective: Understand current state and establish instrumentation standards.
Key activities:
- Audit existing tools: Catalog all monitoring solutions, their costs, coverage gaps, and redundancies
- Map critical paths: Identify your top 10 revenue-generating user journeys and the services involved
- Establish baseline metrics: Measure current MTTD (mean time to detect) and MTTR for incidents
- Select observability platform: Run 30-day POCs with 2-3 vendors on a representative microservice
- Define instrumentation standards: Create OpenTelemetry implementation guides and code templates
Success criteria: Executive sponsorship secured, platform selected, instrumentation standards documented.
Phase 2: Pilot Implementation (Months 4-6)
Objective: Prove observability value on high-impact services.
Key activities:
- Instrument critical path services: Add OpenTelemetry to the 15-20 services in your revenue-critical flows
- Deploy unified collection: Set up OpenTelemetry Collectors and configure pipeline to observability backend
- Build foundational dashboards: Create service-level RED metric dashboards and trace exploration views
- Establish on-call runbooks: Document how to use traces and logs during incident response
- Train first responders: Run workshops with on-call engineers on observability-driven debugging
Success criteria: First major incident resolved 50%+ faster using new observability tools, positive engineer feedback.
Phase 3: Platform Rollout (Months 7-12)
Objective: Achieve comprehensive observability coverage across all production services.
Key activities:
- Instrument remaining services: Rollout OpenTelemetry to all microservices using automated scaffolding
- Implement intelligent sampling: Configure tail-based sampling to control trace volume and costs
- Build business-context dashboards: Create views showing business metrics (transactions, revenue) alongside technical metrics
- Integrate with incident management: Connect observability alerts to PagerDuty/Opsgenie with intelligent routing
- Migrate from legacy tools: Decommission redundant monitoring systems as observability coverage grows
Success criteria: 90%+ of production services instrumented, MTTR reduced by 40%+, legacy tool costs reduced by 60%.
Phase 4: Optimization and Maturity (Months 13-18)
Objective: Drive continuous improvement and advanced capabilities.
Key activities:
- Implement SLO-based alerting: Shift from threshold alerts to error budget consumption monitoring
- Enable developer self-service: Empower product teams to build their own dashboards and queries
- Introduce predictive analytics: Use ML-based anomaly detection to catch issues before they impact customers
- Optimize costs: Analyze telemetry data value and adjust retention, sampling, and collection strategies
- Measure business impact: Quantify observability’s effect on revenue protection, customer satisfaction, and engineering productivity
Success criteria: Observability embedded in development workflow, proactive issue detection exceeds reactive alerts, positive ROI demonstrated.
Measuring Business Impact: The Observability ROI Framework
Executive teams need quantifiable metrics to justify observability investments. The strategic metrics that matter:
Customer Impact Metrics
- Mean Time to Detect (MTTD): Target 60% reduction in first year
- Mean Time to Resolve (MTTR): Target 50% reduction in first year
- Customer-Impacting Incidents: Target 40% reduction through proactive detection
- P1 Incident Rate: Measure decrease in severity escalations
Datadog’s 2024 State of Observability report surveyed 2,400 enterprises and found that organizations with mature observability practices averaged:
- MTTD: 3.2 minutes (vs 18.7 minutes for those with basic monitoring)
- MTTR: 34 minutes (vs 3.1 hours)
- 67% fewer customer-impacting outages annually
Engineering Productivity Metrics
- On-Call Engineer Burnout: Measure alert fatigue and off-hours pages
- Debugging Time per Incident: Track hours spent troubleshooting
- Cross-Team Escalations: Reduce coordination overhead during incidents
- Deploy Frequency: Enable safer, more frequent deployments through confidence in observability
Target’s engineering organization reported in their August 2024 developer experience survey that observability improvements correlated with a 34% increase in developer satisfaction scores and 28% reduction in on-call burnout.
Financial Metrics
- Revenue Protection: Calculate prevented downtime costs
- Engineering Cost Avoidance: Measure reduced debugging hours at loaded engineering rates
- Tool Consolidation Savings: Quantify eliminated legacy monitoring licenses
- Cloud Cost Optimization: Use observability to identify resource waste
A financial services company I advised quantified their observability ROI:
- Investment: $480K (Year 1 platform costs + implementation)
- Returns: $2.1M (prevented downtime revenue loss) + $620K (engineering productivity) + $180K (decommissioned tools)
- Net ROI: 4.8x in Year 1, accelerating to 8.2x in Year 2 as observability maturity increased
Strategic Imperatives for 2025 and Beyond
As we look toward 2025, several trends will reshape enterprise observability strategies:
OpenTelemetry universality: By Q2 2025, analyst firm Forrester predicts that OpenTelemetry will be the default instrumentation standard for 80% of cloud-native applications. CTOs should mandate OTel now to avoid future vendor lock-in and instrumentation rewrites.
AI-driven insights: The next battleground is autonomous observability—systems that don’t just collect data but automatically identify root causes. Datadog’s Watchdog and New Relic’s AI capabilities are early indicators. Expect rapid advancement in LLM-powered incident analysis and automated remediation recommendations.
Security and observability convergence: The line between observability and security monitoring is blurring. Runtime application security requires the same telemetry data as performance observability. Forward-thinking CTOs are building unified platforms that serve both SRE and security teams.
FinOps integration: As cloud costs balloon, observability data becomes critical for cost attribution and optimization. Linking trace data to compute costs enables precise understanding of which features, customers, or tenants drive infrastructure spend.
The strategic question isn’t whether to invest in observability—it’s whether you’ll lead or lag as distributed architectures make it a competitive necessity. The companies that instrument comprehensively, invest in observability engineering talent, and treat telemetry data as a strategic asset will win the reliability and velocity battle in the years ahead.
For CTOs evaluating their 2025 technology roadmaps, observability deserves a seat at the table alongside cloud migration, AI/ML initiatives, and security modernization. The systems you can’t see, you can’t optimize. And in an era where user experience is measured in milliseconds and downtime costs are measured in millions, observability is the foundation of operational excellence.
Ready to transform your enterprise observability strategy? Explore how modern cloud architectures and platform engineering practices can accelerate your journey toward truly observable systems.
For hands-on guidance on cloud migration and managed IT, my team at Cloud Geeks helps Australian businesses implement these strategies.
I lead Ganda Tech Services, where we turn digital strategy into results through specialist cloud, web design, and mobile app teams across Sydney.
About the Author
Ashish Ganda is the founder of Ganda Tech Services, a Sydney-based technology consultancy specialising in cloud infrastructure, web development, and mobile app solutions for Australian businesses.
Digital Transformation Roadmap 2026
A 12-month framework for Australian SMBs ready to modernise — phases, tools, and milestones.