Enterprise Observability: Datadog vs New Relic vs Dynatrace
The observability market has matured into a strategic platform decision for enterprise CTOs. As organizations migrate workloads to cloud-native architectures and adopt microservices at scale, the choice between Datadog, New Relic, and Dynatrace represents more than a monitoring tool selection—it defines your organization’s ability to maintain reliability, optimize performance, and accelerate incident resolution across increasingly complex distributed systems.
With enterprise observability spending projected to reach $5.4 billion in 2024, according to Gartner’s recent infrastructure monitoring analysis, platform vendors are differentiating on architecture approaches, AI-driven analytics capabilities, and total cost of ownership models. For CTOs managing multi-cloud environments with hundreds of microservices, the stakes extend beyond technical features to strategic considerations: vendor lock-in risk, data governance requirements, and the platform’s ability to scale with organizational growth.
Platform Architecture and Data Collection Approach
The foundational architectural differences between these platforms shape their enterprise capabilities and implementation complexity.
Dynatrace pioneered the OneAgent approach, deploying a single intelligent agent that automatically discovers application topology, instruments code without modification, and streams observability data to the platform. This architecture reduces operational overhead for large enterprises—OneAgent deployment across 10,000+ hosts typically completes in hours rather than weeks. The agent’s automatic instrumentation covers 500+ technologies out-of-box, from Java and .NET to Kubernetes operators and cloud services. For enterprises with diverse technology stacks, this breadth eliminates the instrumentation gap that often plagues observability initiatives.
Datadog employs a lightweight agent model combined with extensive integrations—currently supporting 650+ technologies. The platform emphasizes flexibility, allowing teams to instrument applications using language-specific libraries, StatsD for custom metrics, or OpenTelemetry for vendor-neutral telemetry. This modular approach appeals to platform engineering teams that value control over automated discovery. However, achieving comprehensive coverage across heterogeneous environments requires more configuration effort compared to Dynatrace’s automatic instrumentation.
New Relic recently pivoted its architecture with the introduction of New Relic One, consolidating previously disparate products into a unified telemetry data platform. The company embraced OpenTelemetry as a strategic direction, positioning itself as the vendor-neutral observability destination. Their agent deployment model mirrors traditional APM approaches with language-specific agents, though automatic instrumentation capabilities continue to improve. For enterprises concerned about vendor lock-in, New Relic’s OpenTelemetry commitment offers the most flexibility to switch platforms without re-instrumentation.
The architectural implications extend to data retention and query performance. Dynatrace stores observability data in PurePath format, optimized for distributed trace analysis but less flexible for custom analytics. Datadog’s time-series database excels at metric queries across long time horizons, crucial for capacity planning and trend analysis. New Relic’s NRDB (New Relic Database) provides SQL-like querying with NRQL, familiar to teams accustomed to relational databases, though query performance varies significantly based on data volumes and cardinality.
Application Performance Monitoring and Distributed Tracing
APM capabilities distinguish how each platform helps organizations understand application behavior in production environments.
Dynatrace’s AI-driven APM leverages Davis, their deterministic AI engine, to automatically baseline application performance and detect anomalies without threshold configuration. In enterprise deployments at organizations like Kroger and BMW, Davis analyzes billions of dependencies per day to identify root causes within seconds. The platform’s PurePath distributed tracing captures 100% of transactions without sampling, critical for diagnosing intermittent issues that affect specific customer segments. This comprehensive tracing comes at a cost—data ingestion pricing can escalate quickly for high-transaction applications processing millions of requests daily.
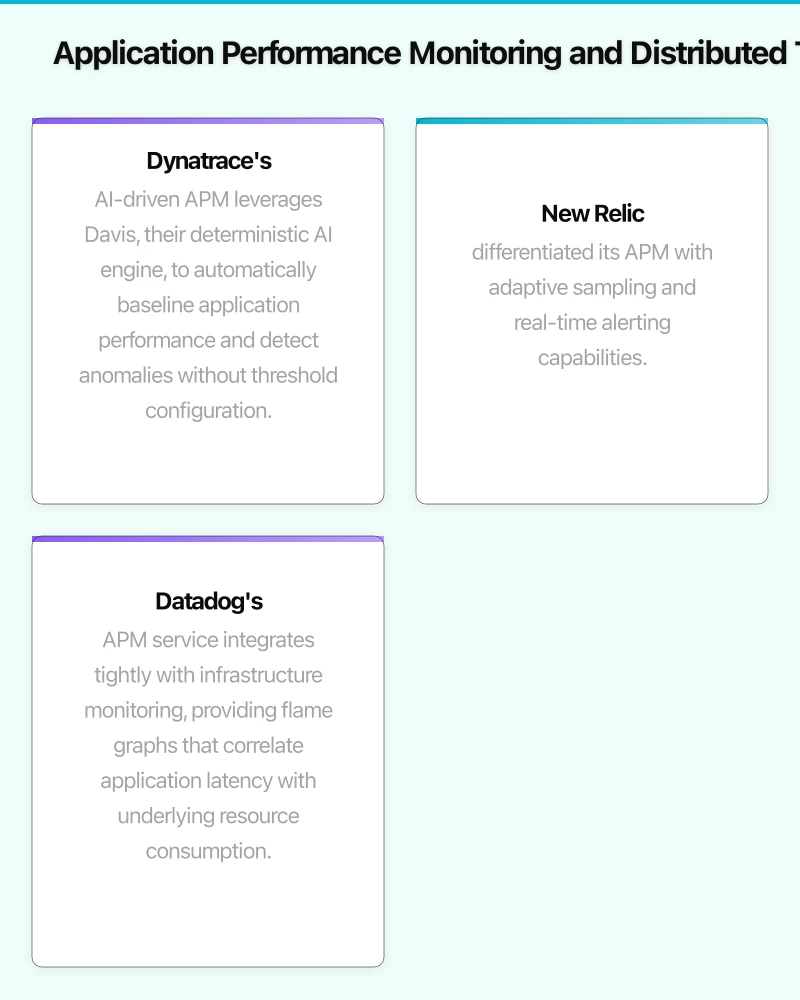
New Relic differentiated its APM with adaptive sampling and real-time alerting capabilities. The platform’s distributed tracing provides visibility across microservices boundaries, though default sampling rates (10% of traces) mean some issues may escape detection. For enterprises, New Relic’s strength lies in its correlation of APM data with infrastructure metrics and logs, enabling engineers to pivot from slow database queries to underlying storage I/O constraints within a single interface. Organizations like GitHub report reducing MTTD (mean time to detect) by 60% after standardizing on New Relic’s unified observability approach.
Datadog’s APM service integrates tightly with infrastructure monitoring, providing flame graphs that correlate application latency with underlying resource consumption. The platform’s trace search and analytics enable complex queries across distributed traces—for example, identifying all traces involving specific Kubernetes pods during deployment windows. Datadog’s deployment tracking automatically correlates application performance changes with code deployments, a critical capability for enterprises practicing continuous delivery at scale.
Error tracking across these platforms reveals different philosophies. Dynatrace automatically groups errors by root cause using AI analysis, reducing alert noise for SRE teams. Datadog provides detailed error analytics with integration to incident management platforms like PagerDuty and Slack. New Relic offers code-level visibility in error stack traces, accelerating remediation for development teams.
Infrastructure Monitoring and Cloud Integration
Modern observability extends beyond applications to encompass infrastructure, container orchestration, and cloud service dependencies.
Datadog leads in infrastructure monitoring breadth, with native integrations for AWS, Azure, GCP, and 450+ technologies. The platform’s infrastructure mapping automatically visualizes relationships between cloud resources, containers, and services—essential for understanding blast radius during incidents. Large enterprises like Peloton and Whole Foods leverage Datadog’s customizable dashboards to provide role-specific views: SRE teams monitor SLI metrics, while finance teams track cloud spending correlated to infrastructure utilization.
Dynatrace’s Smartscape topology mapping automatically discovers and visualizes infrastructure dependencies in real-time, updating as environments change. This dynamic mapping extends to Kubernetes, where Dynatrace provides workload-level visibility including resource quotas, pod health, and service mesh communication patterns. For enterprises operating multi-cloud environments, Smartscape’s unified view eliminates blind spots that emerge when using cloud-native monitoring tools in isolation.
New Relic strengthened its infrastructure monitoring through acquisitions, including Pixie for Kubernetes observability. The platform now offers eBPF-based monitoring for Linux systems, capturing kernel-level metrics without agent overhead. For enterprises with security compliance requirements, New Relic’s infrastructure agent runs in restricted environments where other agents require elevated privileges. However, integration depth with cloud provider services (AWS CloudWatch, Azure Monitor) remains narrower compared to Datadog’s extensive cloud partnerships.
Cloud cost optimization represents an emerging observability use case. Datadog’s Cloud Cost Management correlates infrastructure spending with application performance, enabling teams to identify over-provisioned resources. Enterprises report 20-30% cloud cost reductions after implementing Datadog’s cost anomaly detection and rightsizing recommendations.
Log Management and Analytics
Comprehensive observability requires correlating metrics, traces, and logs to understand system behavior holistically.
Datadog Logs provides centralized log aggregation with advanced filtering, pattern detection, and archive capabilities to S3 or Azure Blob Storage for long-term retention. The platform’s log-to-metrics feature converts high-cardinality log data into efficient metric streams, reducing storage costs while preserving queryability. Financial services organizations leverage Datadog’s audit trail capabilities for compliance, with log retention policies enforced at the platform level.
New Relic Logs integrates directly with the telemetry data platform, enabling unified queries across logs, metrics, and traces using NRQL. The context-preserving log ingestion automatically links log entries to related traces and infrastructure entities, accelerating troubleshooting workflows. However, log ingestion pricing can escalate rapidly—enterprises must implement careful filtering to avoid ingesting verbose debug logs that provide minimal value at significant cost.
Dynatrace Log Management launched more recently compared to competitors, leveraging AI to automatically identify relevant log patterns during incidents. The platform’s log enrichment adds topology context, linking log entries to specific services and infrastructure components. For enterprises already standardized on Dynatrace, the integrated log management eliminates data silos. Organizations migrating from dedicated log platforms like Splunk should evaluate query flexibility, as Dynatrace’s log analytics capabilities remain less mature than purpose-built log management solutions.
Log retention economics differ significantly across vendors. Datadog offers flexible retention from 3 days to 18 months with granular pricing tiers. New Relic includes 30 days of log retention in standard pricing but charges incrementally for longer windows. Dynatrace bundles log retention with platform licensing, simplifying budgeting but potentially over-provisioning for organizations with modest log volumes.
AI and Automation Capabilities
Advanced observability platforms leverage AI to reduce manual threshold configuration and accelerate root cause analysis.
Dynatrace’s Davis AI represents the most mature AI implementation, processing billions of dependencies to provide deterministic root cause analysis. Unlike probabilistic machine learning models, Davis applies causality analysis to identify precise fault origins—for example, determining whether application latency stems from database query changes, increased load, or infrastructure degradation. At enterprise scale, Davis reduces alert storms from thousands of symptoms to single root cause problems, decreasing MTTR by 70% according to customer case studies from ANZ Bank and Caterpillar.
Datadog’s Watchdog uses machine learning to detect anomalies across metrics and logs, surfacing unexpected behavior in infrastructure and applications. The platform’s anomaly detection adapts to seasonal patterns and growth trends, reducing false positives that plague static threshold alerting. Watchdog insights proactively notify teams of emerging issues—such as gradual memory leaks or storage exhaustion—before customer impact occurs. For enterprises managing thousands of services, Watchdog’s automatic anomaly detection provides essential signal amidst metric noise.
New Relic Applied Intelligence correlates alerts across multiple sources, reducing alert fatigue through intelligent grouping and noise reduction. The platform’s incident intelligence automatically creates incidents from related alerts, learns from human decision-making (which alerts teams acknowledge or suppress), and improves correlation over time. This feedback loop helps enterprises tune alerting policies without extensive manual threshold configuration.
Automation capabilities extend beyond anomaly detection to remediation workflows. All three platforms integrate with incident response tools (PagerDuty, Opsgenie) and ChatOps platforms (Slack, Microsoft Teams). Dynatrace’s application-aware infrastructure monitoring can trigger auto-scaling responses based on application performance thresholds, enabling self-healing architectures.
Enterprise Requirements: Security, Compliance, and Governance
Platform selection must account for security posture, regulatory compliance, and data governance requirements.
Data Sovereignty: All three vendors offer regional data residency to meet GDPR, CCPA, and sector-specific compliance requirements. Dynatrace operates managed environments in 40+ regions globally, with dedicated instances for regulated industries like healthcare and finance. Datadog provides EU and US data centers with guaranteed data residency. New Relic’s distributed architecture enables regional deployment with data locality controls.
Access Control: Enterprise implementations require granular RBAC (role-based access control). Datadog’s Teams feature provides multi-tenancy within a single organization, isolating metrics and logs across business units. Dynatrace implements management zones that segment environments while enabling centralized administration. New Relic’s account hierarchy supports organizational structures with inherited policies and delegated administration.
Audit and Compliance: Financial services and healthcare organizations require comprehensive audit trails. All three platforms log administrative actions, data access, and configuration changes. Datadog achieves SOC 2 Type II, ISO 27001, and PCI DSS compliance, with audit reports available to enterprise customers. Dynatrace maintains FedRAMP authorization for U.S. government deployments. New Relic provides compliance documentation for HIPAA, SOC 2, and ISO certifications.
Data Privacy: Observability platforms ingest application data that may contain PII (personally identifiable information). Dynatrace automatically masks sensitive data using configurable patterns, preventing credential leakage in traces and logs. Datadog’s sensitive data scanner detects and redacts PII across logs and APM traces. New Relic offers data scrubbing rules to filter sensitive information at ingestion, reducing compliance scope.
Total Cost of Ownership Analysis
Observability platform costs extend beyond subscription fees to include implementation effort, training, and operational overhead.
Datadog Pricing: The platform uses host-based pricing with tiered functionality (Infrastructure at $15/host/month, APM at $31/host/month, full observability suite at $40+/host/month). Additional charges apply for custom metrics ($0.05 per metric), log ingestion ($0.10 per GB), and data retention extensions. For enterprises with 1,000 hosts and moderate data volumes, annual costs range from $500K to $1.5M depending on feature adoption and data volumes. Datadog’s pricing transparency enables accurate forecasting, though costs can escalate rapidly with custom metrics proliferation.
New Relic Pricing: The platform shifted to user-based pricing in 2020, charging per full platform user ($99-$549/user/month depending on tier) with unlimited data ingestion up to retention limits. This model benefits data-intensive organizations that would face high ingestion costs on competing platforms. However, user-based pricing creates cost pressure as teams scale—enterprises with 100 full platform users face $120K-$660K annually before considering premium features. New Relic’s consumption-based pricing for compute and storage adds complexity to cost prediction.
Dynatrace Pricing: The platform bundles comprehensive observability capabilities in full-stack monitoring SKUs, starting at approximately $70 per host/month. While list pricing appears higher than competitors, Dynatrace includes features (automatic instrumentation, AI-driven analytics, unlimited dashboards) that require additional SKUs from other vendors. Enterprise agreements negotiate volume discounts, with large deployments (5,000+ hosts) achieving 40-50% reductions from list pricing. Annual costs for comprehensive observability at 1,000 hosts typically range from $700K to $1.2M.
Hidden Costs: Implementation services represent significant expenses beyond subscription fees. Datadog’s modular approach typically requires 3-6 months for enterprise-wide deployment with SI partner assistance ($150K-$300K services engagement). Dynatrace’s OneAgent simplifies deployment but requires investment in training teams on AI-driven workflows and topology analysis ($50K-$100K enablement). New Relic’s unified platform reduces integration complexity, though migration from legacy APM tools incurs code instrumentation effort.
Strategic Recommendations for Enterprise Selection
Platform selection should align with organizational priorities, existing technology investments, and long-term observability strategy.
Choose Dynatrace if: Your organization prioritizes automated root cause analysis and comprehensive coverage with minimal operational overhead. Dynatrace fits enterprises with complex distributed architectures, limited observability expertise, and willingness to invest in premium capabilities. The platform particularly excels for organizations running SAP, mainframe integrations, or highly regulated environments requiring deterministic incident analysis.
Choose Datadog if: Your teams value flexibility, extensive integrations, and customizable analytics. Datadog suits platform engineering organizations that build internal developer platforms and require granular control over instrumentation. The platform’s strength in cloud infrastructure monitoring makes it ideal for cloud-native enterprises running containers and serverless architectures at scale. Cost-conscious organizations should implement strict governance around custom metrics to control spending.
Choose New Relic if: Vendor neutrality and OpenTelemetry standardization align with your strategy. New Relic fits organizations concerned about vendor lock-in or planning phased observability adoption. The user-based pricing benefits data-intensive applications with high transaction volumes. Enterprises with existing Pixie deployments or significant open source instrumentation gain natural migration paths to New Relic’s platform.
Multi-Vendor Strategy: Some enterprises deploy multiple observability platforms strategically—for example, using Dynatrace for production monitoring while leveraging Datadog’s cost-effective development environment observability. This approach introduces operational complexity but mitigates vendor concentration risk and enables best-of-breed capabilities per environment.
Implementation Roadmap Considerations
Successful enterprise observability implementations follow phased approaches rather than attempting comprehensive deployment simultaneously.
Phase 1 - Foundation (0-3 months): Instrument critical production services with APM and infrastructure monitoring. Establish baseline SLIs (Service Level Indicators) and configure alerting for business-critical workflows. For enterprises migrating from legacy monitoring, run parallel systems during validation to ensure observability continuity.
Phase 2 - Expansion (3-9 months): Extend instrumentation to supporting services, implement distributed tracing, and integrate log management. Train engineering teams on platform capabilities and establish runbook procedures incorporating observability data. Configure dashboards aligned to team responsibilities (SRE reliability metrics, development deployment tracking, business KPI monitoring).
Phase 3 - Optimization (9-18 months): Leverage AI-driven analytics to reduce alert fatigue, implement automated remediation workflows, and establish observability-driven incident response. Integrate observability data into capacity planning, cost optimization, and application performance SLOs. Evaluate advanced capabilities like synthetic monitoring, user experience tracking, and business analytics.
Looking Forward: The Observability Platform Evolution
The observability market continues rapid innovation driven by cloud-native architecture adoption and AI advancement. OpenTelemetry standardization will reduce vendor lock-in concerns, enabling enterprises to instrument applications once while preserving flexibility to switch platforms. Security observability—integrating threat detection with performance monitoring—represents an emerging category as organizations seek unified visibility across DevOps and SecOps workflows.
For CTOs evaluating observability platforms in 2024, the decision transcends technical feature comparison to strategic platform thinking. The winning observability strategy balances comprehensive coverage with cost sustainability, provides AI-driven insights without requiring PhD-level expertise, and positions the organization to adopt emerging architectural patterns like service mesh and edge computing. Whether choosing Datadog’s flexibility, Dynatrace’s automation, or New Relic’s openness, the key lies in aligning platform capabilities with your organization’s observability maturity and growth trajectory.
Evaluating observability platforms for your enterprise architecture? Contact Ash Ganda for strategic guidance on platform selection, implementation planning, and observability maturity assessment.
The strategic frameworks I discuss here come to life through execution. Cloud Geeks covers the practical side of cloud infrastructure and IT management.
I lead Ganda Tech Services, where we turn digital strategy into results through specialist cloud, web design, and mobile app teams across Sydney.
About the Author
Ashish Ganda is the founder of Ganda Tech Services, a Sydney-based technology consultancy specialising in cloud infrastructure, web development, and mobile app solutions for Australian businesses.
Tech Stack Selection Guide 2026
Choose the right tools for your Australian business — without the vendor hype or overlapping spend.