Enterprise Graph Database Use Cases
Introduction
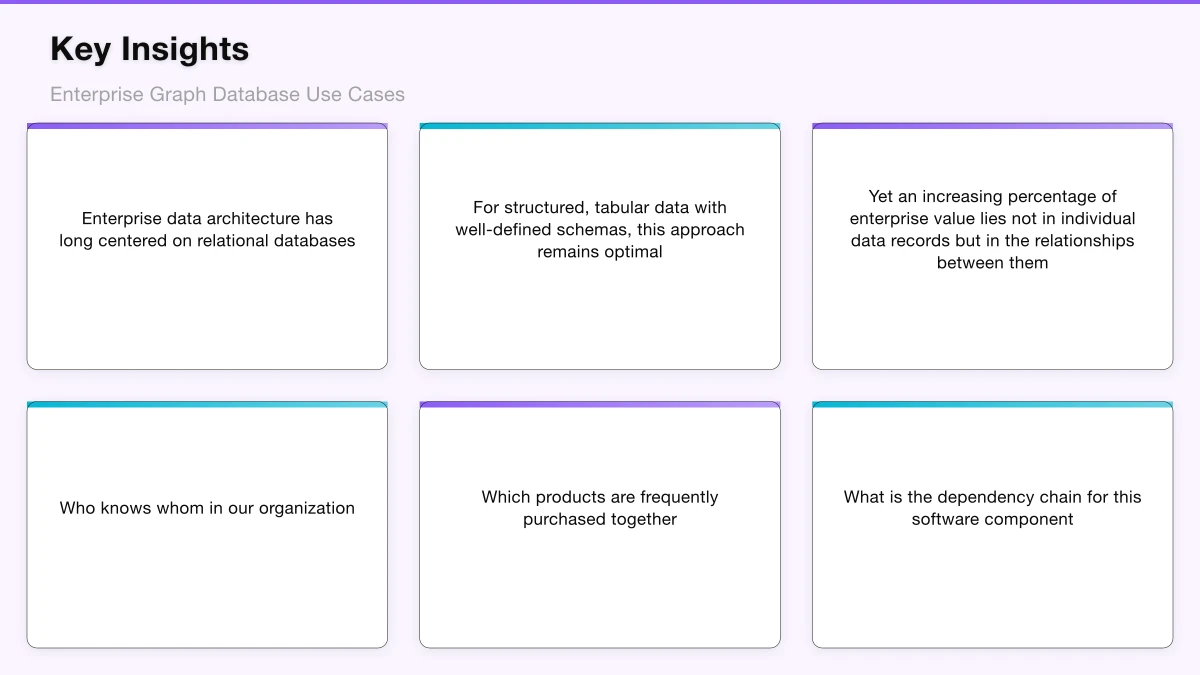
Enterprise data architecture has long centered on relational databases. For structured, tabular data with well-defined schemas, this approach remains optimal. Yet an increasing percentage of enterprise value lies not in individual data records but in the relationships between them.
Who knows whom in our organization? Which products are frequently purchased together? What is the dependency chain for this software component? How is this transaction connected to known fraudulent patterns? These questions require traversing relationships, and relational databases struggle with relationship-intensive queries.
Graph databases have emerged as a specialized solution for highly connected data. Unlike relational databases that store data in tables with foreign key relationships, graph databases store nodes (entities) and edges (relationships) as first-class objects, enabling efficient traversal of complex relationship networks.
The graph database market is maturing rapidly. Neo4j, the market leader, recently secured $325 million in funding at a $2 billion valuation. Cloud providers offer managed graph services—Amazon Neptune, Azure Cosmos DB with Gremlin API. Enterprise adoption is accelerating across industries.
This article provides strategic guidance for CTOs evaluating graph databases, including clear use case criteria, implementation considerations, and practical deployment guidance.
Understanding Graph Database Fundamentals
Before examining use cases, technology leaders must understand what graph databases do differently and why that difference matters.
The Property Graph Model
The dominant graph database model is the property graph, which consists of:
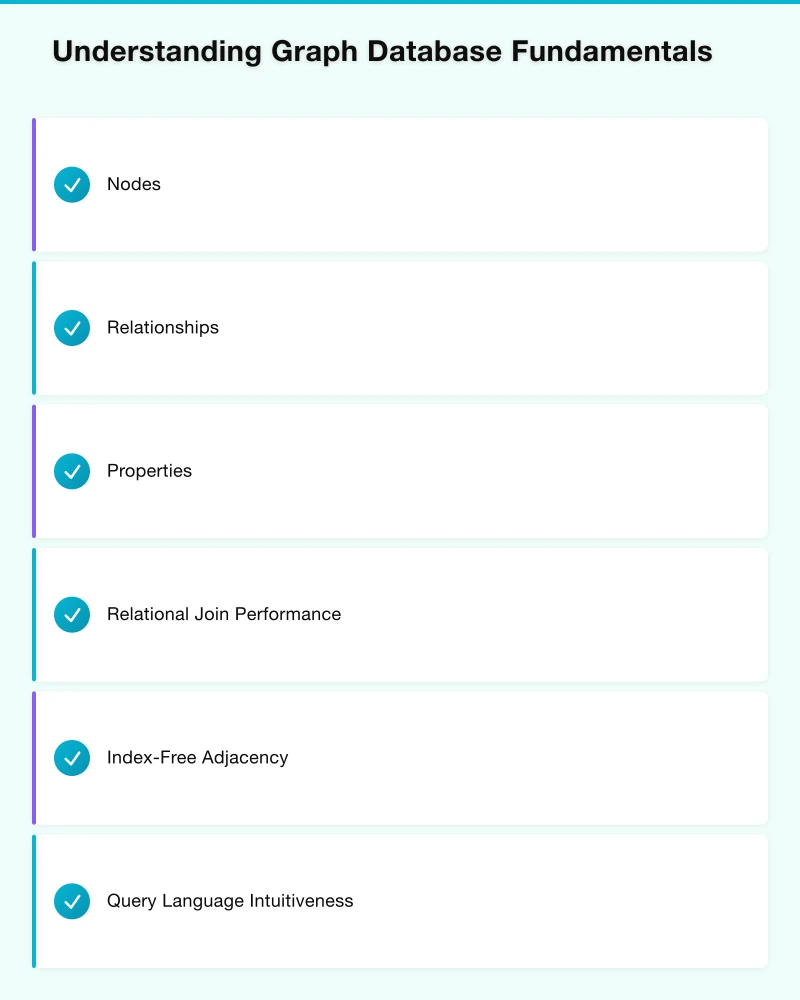
Nodes: Entities or objects with labels indicating their type. A node might represent a Person, Company, Product, or Account.
Relationships: Connections between nodes with types indicating the nature of the connection. Relationships have direction and can connect nodes of any type. Examples: WORKS_FOR, PURCHASED, DEPENDS_ON.
Properties: Key-value pairs attached to both nodes and relationships. A Person node might have properties for name, title, and department. A WORKS_FOR relationship might have properties for start_date and role.
This model maps naturally to how business users think about their domain. Entity-relationship diagrams translate directly to graph structures.
Why Graphs Outperform for Connected Data
The performance advantage of graph databases for relationship queries stems from fundamental architecture differences.
Relational Join Performance
In relational databases, following relationships requires joins. Finding friends-of-friends-of-friends requires three joins. Each join involves index lookups and table scans. Performance degrades exponentially with relationship depth.
For a social network query finding 4th-degree connections:
- Relational: Minutes to hours, often times out
- Graph: Milliseconds to seconds
Index-Free Adjacency
Graph databases use index-free adjacency: each node directly references its connected nodes. Traversing a relationship is a pointer hop, not an index lookup. Performance depends on the number of relationships traversed, not the total database size.
Query Language Intuitiveness
Graph query languages (Cypher for Neo4j, Gremlin for Apache TinkerPop) express relationship traversal naturally.
Finding all products purchased by customers who also purchased a specific product:
MATCH (p:Product {name: "Widget A"})<-[:PURCHASED]-(c:Customer)-[:PURCHASED]->(other:Product)
WHERE other <> p
RETURN other.name, count(c) as co_purchasers
ORDER BY co_purchasers DESC
The equivalent SQL requires multiple subqueries and is far less readable.
Strategic Use Case Evaluation
Graph databases are not a universal solution. Clear criteria help CTOs identify appropriate use cases.
Ideal Use Case Characteristics
High Relationship Density
The data model includes many-to-many relationships. Each entity connects to many others. Relationship traversal is a primary query pattern.
Variable Depth Traversal
Queries need to explore connections to unknown depth—finding all dependencies, tracing all paths, identifying all connections within N degrees.
Relationship Properties Matter
The relationships themselves carry important attributes—not just that A connects to B, but how, when, and with what characteristics.
Schema Flexibility Required
New relationship types and node properties emerge frequently. The schema evolves with business understanding.
Real-Time Query Requirements
Relationship queries must return in milliseconds for operational applications, not minutes for batch analytics.
Poor Use Case Characteristics
Simple, Tabular Data
Data fits naturally into rows and columns. Relationships are limited and well-defined.
Aggregate-Heavy Workloads
Primary queries involve sums, averages, and counts across large datasets rather than relationship traversal.
Write-Heavy, Relationship-Light
High transaction volumes with simple create/update operations on isolated records.
Mature, Stable Schema
Data model is well-understood and changes infrequently. No benefit from schema flexibility.
Enterprise Use Cases in Depth
The following use cases demonstrate graph database value across enterprise domains.
Fraud Detection and Financial Crime
Financial services organizations increasingly deploy graph databases for fraud detection. Fraud often involves networks of entities—accounts, addresses, devices, identities—that appear unrelated in isolation but form suspicious patterns when viewed as a network.
Graph Approach:
Model entities as nodes: accounts, customers, devices, IP addresses, phone numbers, email addresses, physical addresses. Model relationships: OWNS, USES, SHARES_ADDRESS, TRANSFERRED_TO.
Query patterns:
- First-party fraud rings sharing addresses or devices
- Money laundering through chains of transactions
- Synthetic identity networks using similar PII across accounts
- Account takeover through compromised credentials
Example Query: Find accounts connected to known fraud through shared devices or addresses within 3 degrees.
Business Impact:
- Faster fraud detection through real-time graph queries
- Discovery of previously unknown fraud patterns
- Reduced false positives through context consideration
- Investigation efficiency through visual graph exploration
Implementation Considerations:
- Integration with transaction processing systems for real-time data
- Graph algorithm libraries for community detection and anomaly scoring
- Visualization tools for fraud investigator workflows
- Compliance with financial data handling requirements
Knowledge Graphs and Enterprise Data Integration
Large enterprises struggle with data fragmentation. Customer data exists in CRM, billing, support, and marketing systems. Product data spans PLM, ERP, and e-commerce platforms. Knowledge graphs unify these disparate sources into a connected enterprise data layer.
Graph Approach:
Model core business entities: customers, products, employees, locations, transactions. Connect entities through observed relationships: PURCHASED, CREATED_BY, LOCATED_AT, REPORTS_TO. Integrate metadata: source system, confidence, update timestamp.
Example Applications:
- 360-degree customer view connecting all touchpoints
- Product knowledge graph enabling advanced search and recommendations
- Employee expertise graph for knowledge management
- Master data management with relationship-aware deduplication
Business Impact:
- Unified view of business entities across systems
- Discovery of previously invisible connections
- Foundation for AI and machine learning applications
- Reduced data integration complexity
Implementation Considerations:
- Entity resolution to match records across systems
- Incremental update mechanisms from source systems
- Query federation for real-time source integration
- Governance for knowledge graph quality and lineage
Supply Chain and Dependency Mapping
Supply chain disruptions highlight the value of understanding supplier networks beyond direct relationships. Graph databases map multi-tier supplier dependencies, geographic concentrations, and alternative sourcing options.
Graph Approach:
Model nodes: suppliers, components, products, manufacturing facilities, geographic regions. Model relationships: SUPPLIES, CONTAINS, MANUFACTURED_AT, LOCATED_IN.
Example Queries:
- All products affected by disruption at a specific supplier
- Geographic concentration risk across the supply network
- Alternative suppliers for critical components
- Dependency chains for specific products
Business Impact:
- Rapid impact assessment during disruptions
- Proactive risk identification before disruptions occur
- Informed sourcing decisions considering network effects
- Supplier relationship optimization
Implementation Considerations:
- Data collection from procurement, logistics, and external sources
- Supplier hierarchy modeling for corporate relationships
- Temporal modeling for supplier status changes
- Integration with supply chain planning systems
Network and IT Operations
IT environments are inherently graphs—servers connect to networks, applications depend on services, changes propagate through dependencies. Graph databases model these relationships for impact analysis, root cause identification, and configuration management.
Graph Approach:
Model nodes: servers, applications, services, databases, network devices, configuration items. Model relationships: RUNS_ON, DEPENDS_ON, CONNECTS_TO, CONFIGURED_BY.
Example Applications:
- Change impact analysis before infrastructure modifications
- Root cause analysis during incidents
- Configuration drift detection across environments
- Dependency documentation for legacy systems
Business Impact:
- Reduced change-related incidents through better impact analysis
- Faster incident resolution through dependency visibility
- Improved compliance through configuration understanding
- Technical debt identification through dependency mapping
Implementation Considerations:
- Integration with CMDB, monitoring, and discovery tools
- Automated relationship discovery through network analysis
- Temporal modeling for configuration history
- Real-time updates for dynamic environments
Identity and Access Management
Access control in enterprises involves complex relationships—users belong to groups, groups have roles, roles grant permissions, permissions apply to resources. Graph databases naturally model and query these hierarchical and many-to-many relationships.
Graph Approach:
Model nodes: users, groups, roles, permissions, resources, policies. Model relationships: MEMBER_OF, HAS_ROLE, GRANTS, APPLIES_TO.
Example Queries:
- All permissions granted to a user through all paths
- All users with access to a specific resource
- Compliance analysis for segregation of duties
- Access certification based on relationship context
Business Impact:
- Simplified access management through relationship clarity
- Improved compliance through comprehensive access views
- Faster access certification cycles
- Reduced over-privileged access through visibility
Implementation Considerations:
- Integration with identity providers and target systems
- Real-time synchronization for access decisions
- Temporal modeling for access history and audit
- Scale for large user populations and permission sets
Recommendation Engines
Recommendation systems leverage relationships between users, products, content, and behaviors. Graph databases enable sophisticated recommendation queries that consider multiple relationship types and paths.
Graph Approach:
Model nodes: users, products, categories, attributes, behaviors. Model relationships: PURCHASED, VIEWED, RATED, SIMILAR_TO, BELONGS_TO.
Recommendation Patterns:
- Collaborative filtering: Users who purchased X also purchased Y
- Content-based: Products similar to those the user has purchased
- Hybrid: Combining behavioral and content relationships
- Social: Products purchased by connected users
Business Impact:
- Improved recommendation relevance through relationship consideration
- Real-time recommendations during user sessions
- Explainable recommendations through relationship paths
- Cold-start handling through attribute relationships
Implementation Considerations:
- Scale for high-volume user interactions
- Real-time graph updates for session behaviors
- Integration with e-commerce and content platforms
- A/B testing for recommendation algorithm optimization
Technology Selection and Implementation
CTOs must select from multiple graph database options and plan implementation carefully.
Technology Options
Neo4j
Market leader with the most mature product and largest ecosystem. Native graph storage with ACID transactions. Cypher query language is intuitive and powerful. Enterprise features include clustering, role-based access, and encryption.
Best For: Organizations wanting mature, full-featured graph database with strong enterprise capabilities and large talent pool.
Amazon Neptune
AWS managed graph database supporting both property graphs (Gremlin) and RDF (SPARQL). Fully managed with automated backups, encryption, and high availability. Integrates with AWS ecosystem.
Best For: AWS-centric organizations wanting managed service without operational overhead.
Azure Cosmos DB (Gremlin API)
Microsoft’s globally distributed database with graph API option. Multi-model capability allows combining graph with document and key-value access. Strong enterprise features and Azure integration.
Best For: Azure-centric organizations or those wanting multi-model database with graph capabilities.
JanusGraph
Open-source, distributed graph database with pluggable storage backends (Cassandra, HBase, BigTable). Apache TinkerPop compatible with Gremlin queries. Scales horizontally for very large graphs.
Best For: Organizations needing extreme scale or preferring open-source with existing investments in supported storage backends.
Implementation Approach
Phase 1: Proof of Value
Start with a focused use case that demonstrates graph value.
- Select use case with clear business impact and supportive stakeholder
- Load representative data subset into graph database
- Develop prototype queries demonstrating relationship value
- Measure and communicate performance against current approaches
- Build organizational understanding of graph technology
Timeline: 4-8 weeks
Phase 2: Production Pilot
Deploy initial production application with appropriate engineering rigor.
- Design graph data model with domain experts
- Implement data loading from source systems
- Develop production application with proper error handling
- Deploy with monitoring, backup, and security controls
- Measure business impact and user adoption
Timeline: 3-6 months
Phase 3: Enterprise Adoption
Expand graph deployment based on pilot success.
- Identify additional use cases leveraging same or extended graph
- Develop shared data platform capabilities if multiple use cases
- Build internal expertise and best practices
- Establish governance for graph data quality
- Integrate with enterprise architecture standards
Timeline: Ongoing
Data Modeling Best Practices
Graph data modeling differs from relational modeling. Key principles:
Model the Questions
Design the graph to answer specific business questions efficiently. Different questions may require different relationship structures.
Use Relationships Freely
Relationships are cheap in graphs. Model all meaningful connections, even those that seem redundant. Multiple relationship types between the same nodes is common.
Property vs. Relationship Decisions
If you need to query through something, make it a node with relationships. If it’s just an attribute of an entity, make it a property.
Avoid Super Nodes
Nodes with millions of relationships (e.g., “United States” connected to all American users) create performance problems. Design around super nodes with intermediate nodes or relationship properties.
Plan for Temporal
Relationships change over time. Design patterns for temporal modeling—relationship properties with dates, or separate relationships for different time periods.
Challenges and Considerations
Graph database adoption faces predictable challenges.
Organizational Challenges
Skills Gap: Graph technology requires new skills. Cypher or Gremlin proficiency, graph modeling expertise, and graph-native development patterns all require learning investment.
Mitigation: Training programs, vendor professional services for initial projects, hiring with graph experience for key roles.
Cultural Resistance: Teams comfortable with relational approaches may resist graph technology, viewing it as unnecessary complexity.
Mitigation: Clear demonstration of value through proof of concept, involvement of skeptics in evaluation, focus on business outcomes rather than technology.
Technical Challenges
Integration Complexity: Graph databases must integrate with existing data infrastructure—ETL pipelines, query tools, applications, security systems.
Mitigation: Plan integration architecture early, evaluate integration capabilities in technology selection, budget for integration development.
Operational Learning Curve: Graph database operations differ from relational. Backup, monitoring, performance tuning, and scaling require new knowledge.
Mitigation: Consider managed services to reduce operational burden, invest in operations training, engage vendor support during initial deployment.
Data Quality Requirements: Graphs expose data quality issues hidden in siloed relational systems. Duplicate entities, incorrect relationships, and missing connections become visible.
Mitigation: Plan for data quality improvement as part of graph implementation, implement entity resolution processes, establish data stewardship.
Strategic Considerations
Vendor Dependency: The graph database market remains dynamic. Technology selection creates dependency that may limit future options.
Mitigation: Evaluate vendor viability carefully, consider open standards (Apache TinkerPop) for portability, plan data export capabilities.
Use Case Discipline: The enthusiasm for graph technology can lead to inappropriate use cases where relational databases would perform better.
Mitigation: Clear use case evaluation criteria, honest assessment of graph fit, willingness to recommend relational approaches where appropriate.
Measuring Graph Database Success
Clear metrics demonstrate graph value and guide continued investment.
Technical Metrics
- Query performance compared to previous approaches
- Graph size growth and system scaling
- Data freshness from source systems
- System availability and reliability
Business Metrics
- Time to insight for analysis use cases
- Fraud detection rates and false positive reduction
- Recommendation conversion rates
- User adoption of graph-powered applications
Strategic Metrics
- New capabilities enabled by graph technology
- Use case expansion across the enterprise
- Internal expertise development
- Competitive advantage from graph insights
Looking Forward
Graph technology continues evolving. Several trends will shape enterprise adoption.
Graph and Machine Learning: Graph neural networks and graph-based features for machine learning are emerging research areas with enterprise applications in fraud, recommendations, and drug discovery.
Natural Language Querying: Advances in NLP may enable business users to query graphs using natural language rather than Cypher or Gremlin.
Real-Time Graph Analytics: Combining graph databases with stream processing enables real-time detection and response based on relationship patterns.
Industry Knowledge Graphs: Pre-built knowledge graphs for specific industries may accelerate adoption by providing foundational models and data.
Conclusion
Graph databases address a genuine enterprise need: extracting value from connected data that relational databases cannot serve efficiently. The technology has matured to enterprise readiness, with clear use cases delivering measurable business impact.
CTOs evaluating graph databases should:
- Identify use cases matching graph strengths—high relationship density, variable depth traversal, real-time query needs
- Evaluate technology options against organizational context—cloud strategy, operational capabilities, scale requirements
- Start with focused proof of value before enterprise commitment
- Plan for organizational change—skills development, cultural adoption, integration architecture
- Measure success against business outcomes, not just technical metrics
The organizations that master graph technology will discover insights invisible to competitors constrained by tabular thinking. The relationships hiding in enterprise data represent strategic assets waiting to be unlocked.
Enterprise data value increasingly lies in connections rather than records. Graph databases provide the technology to extract that value, but success requires strategic clarity about where and how to apply them.
Turning strategy into infrastructure? Cloud Geeks covers managed cloud, DevOps, and IT security for businesses putting digital plans into action.
As founder of Ganda Tech Services, I work with Australian businesses to align technology investments with business growth — across cloud, web, and mobile.
About the Author
Ashish Ganda is the founder of Ganda Tech Services, a Sydney-based technology consultancy specialising in cloud infrastructure, web development, and mobile app solutions for Australian businesses.
Digital Transformation Roadmap 2026
A 12-month framework for Australian SMBs ready to modernise — phases, tools, and milestones.