Building Enterprise Knowledge Graphs
Enterprise data is abundant but disconnected. Customer records live in CRM systems, product information in catalogue databases, financial data in ERP systems, and organisational knowledge in documents, wikis, and the minds of experienced employees. The relationships between these data domains — which customers buy which products, which teams support which services, which regulations apply to which business processes — are often implicit, encoded in business logic, tribal knowledge, or manual processes.
Knowledge graphs make these relationships explicit, queryable, and actionable. By representing data as entities connected by typed relationships, knowledge graphs create a unified semantic layer that spans organisational silos and enables applications that no single data source could support.
Google’s Knowledge Graph, which powers search result enrichment, is perhaps the most visible example. But the enterprise applications of knowledge graph technology are broader and, for many organisations, more immediately valuable.
When Knowledge Graphs Add Value
Not every data problem requires a knowledge graph. Relational databases, document stores, and data warehouses are well-suited to many enterprise data management needs. Knowledge graphs add distinct value in specific scenarios:
Highly connected data: When the relationships between entities are as important as the entities themselves, and when queries traverse multiple relationship types, graph representations dramatically outperform relational joins. A query like “find all customers who purchased products from suppliers in a specific region, where those suppliers also supply our competitors” involves multiple entity types and relationship traversals that are natural in a graph and painful in SQL.
Schema flexibility: When the data model evolves frequently, when different entity types have different attributes, or when new relationship types emerge regularly, the schema-flexible nature of knowledge graphs avoids the costly schema migrations that relational databases require. This is particularly valuable during the early phases of building a knowledge system, when the ontology is being discovered rather than designed.
Semantic reasoning: When the organisation needs to infer new knowledge from existing data, knowledge graphs support reasoning through ontologies that define class hierarchies, property inheritance, and logical rules. An ontology that defines “a subsidiary of a company is also a company” enables automatic classification of entities and relationship inference.
Integration of heterogeneous sources: When data from multiple systems with different schemas needs to be queried holistically, a knowledge graph provides a common semantic model that unifies disparate sources without requiring them to adopt a single schema.
Architecture and Technology Choices
Enterprise knowledge graph architecture involves three layers: the graph database, the ontology and schema, and the ingestion and integration pipeline.
Graph Database Selection: The two primary graph database categories are property graphs and RDF (Resource Description Framework) triple stores. Property graphs, implemented by Neo4j, Amazon Neptune, and TigerGraph, represent entities as nodes with properties and relationships as edges with properties. They use query languages like Cypher (Neo4j) and Gremlin (Apache TinkerPop). RDF triple stores, implemented by Stardog, GraphDB, and Amazon Neptune (which supports both), represent knowledge as subject-predicate-object triples and use SPARQL for querying.
For most enterprise applications, property graphs provide a more intuitive model and better performance for traversal queries. RDF triple stores are preferable when formal ontology reasoning, standards compliance (W3C Semantic Web standards), or integration with linked open data sources is important. Healthcare, life sciences, and government organisations with formal ontology requirements often favour RDF.
Ontology Design: The ontology defines the types of entities and relationships in the knowledge graph. Good ontology design balances expressiveness with simplicity. An overly complex ontology creates barriers to adoption and makes queries unnecessarily difficult. An overly simple ontology fails to capture important distinctions.
I recommend an iterative approach to ontology design: start with a core set of entity types and relationships that address immediate use cases, validate the ontology against real data and real queries, and extend it incrementally as new use cases emerge. Reusing established ontologies (Schema.org for general concepts, FIBO for financial services, SNOMED CT for healthcare) accelerates development and improves interoperability.
Data Ingestion Pipeline: Populating a knowledge graph from enterprise source systems requires an ingestion pipeline that extracts data, maps it to the ontology, resolves entity identities across sources, and loads it into the graph database.
Entity resolution — determining that “IBM,” “International Business Machines,” and “IBM Corp.” refer to the same entity — is one of the most challenging aspects of knowledge graph construction. Techniques range from rule-based matching (exact match on standardised identifiers) to machine learning approaches that consider multiple attributes to determine entity equivalence.
The ingestion pipeline should be incremental, processing changes from source systems rather than full reloads. Change data capture (CDC) from operational databases, event streams from enterprise messaging systems, and scheduled API calls from SaaS platforms form common ingestion patterns.
Enterprise Use Cases
Several enterprise use cases demonstrate the practical value of knowledge graphs:
Customer 360: Connecting customer data from CRM, support, billing, marketing, and product usage systems into a unified graph enables a complete view of the customer relationship. Sales teams can see not just the customer’s purchase history but their support issues, their connections to other customers, their engagement with marketing content, and their product usage patterns. Graph traversals reveal relationships that flat customer records cannot: “this customer’s CTO previously worked at another customer where they championed our product.”
Regulatory Compliance: Financial services organisations use knowledge graphs to track beneficial ownership, map corporate hierarchies, and identify potential sanctions violations. The complex, multi-layered corporate structures used in global commerce are natural graph structures. Traversing ownership chains to determine ultimate beneficial ownership is a graph query, not a relational join.
IT Service Management: Mapping the relationships between applications, infrastructure, teams, and business processes in a knowledge graph enables impact analysis (“if this server fails, which applications are affected and which business processes depend on those applications?”), change risk assessment, and service dependency visualisation.
Research and Development: Pharmaceutical companies use knowledge graphs to connect drug compounds, disease mechanisms, clinical trial results, and scientific literature. Graph-based analysis reveals potential drug repurposing opportunities, identifies promising research directions, and accelerates literature review by connecting related findings across thousands of publications.
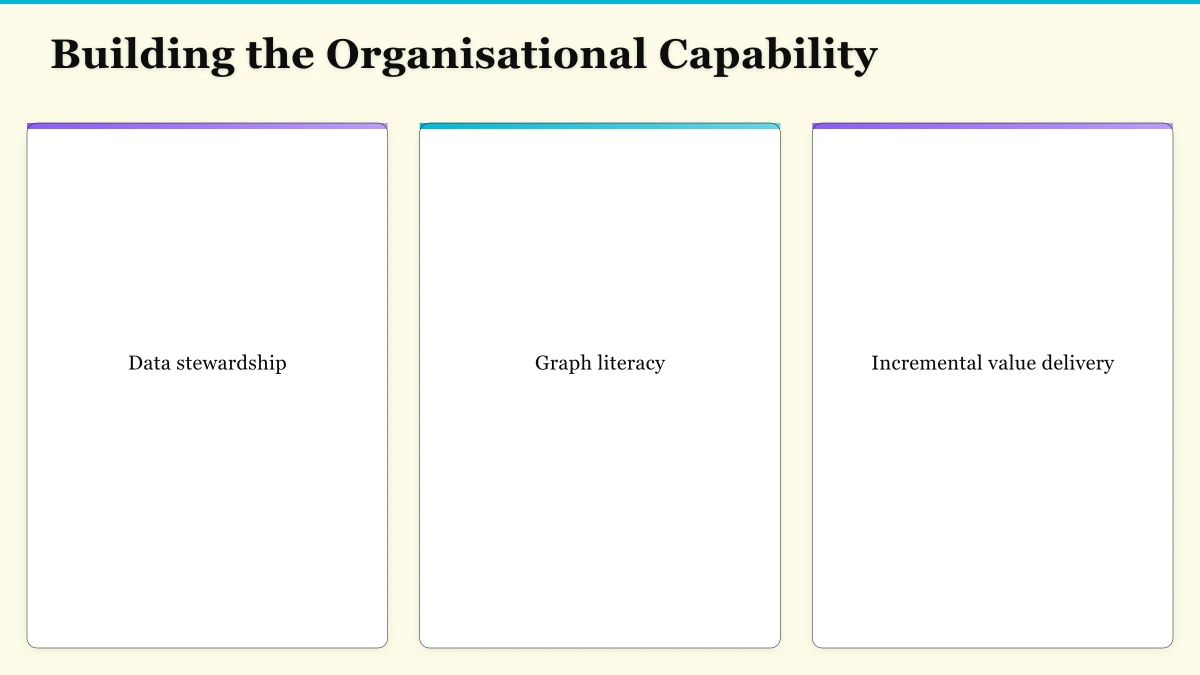
Building the Organisational Capability
Technology is necessary but not sufficient for enterprise knowledge graph success. The organisational capability requires:
Data stewardship: Knowledge graphs are only as valuable as the data they contain. Domain experts must validate the ontology, review entity resolution results, and curate the knowledge graph content. This requires dedicated data stewardship roles and processes.
Graph literacy: Developers, analysts, and business users need to understand how to query and interpret graph data. Graph query languages (Cypher, SPARQL, Gremlin) have different paradigms than SQL, and graph visualisation requires different analytical approaches than tabular data. Investing in training and tooling that make the knowledge graph accessible to non-specialists is essential for adoption.
Incremental value delivery: Knowledge graph initiatives that attempt to model the entire enterprise before delivering value inevitably fail. Starting with a focused use case — customer 360 for the sales organisation, or service dependency mapping for IT operations — delivers value quickly and builds organisational support for expansion.
The knowledge graph is not a project with a completion date. It is an evolving enterprise asset that grows more valuable as more data sources are connected, more relationships are modelled, and more applications consume its intelligence. The CTO who invests in this capability builds a strategic data asset that compounds in value over time, connecting the disconnected data that every enterprise accumulates and transforming it into actionable knowledge.
Need to put cloud strategy into action? Cloud Geeks provides in-depth guides on AWS, Azure, and cybersecurity for Australian SMBs.
My consultancy Ganda Tech Services operates three specialist divisions covering cloud infrastructure, web development, and mobile apps for Australian businesses.
About the Author
Ashish Ganda is the founder of Ganda Tech Services, a Sydney-based technology consultancy specialising in cloud infrastructure, web development, and mobile app solutions for Australian businesses.
Digital Transformation Roadmap 2026
A 12-month framework for Australian SMBs ready to modernise — phases, tools, and milestones.