Enterprise Observability: Beyond Traditional Monitoring
The monitoring practices that served enterprises well for decades are failing in modern architectures. Traditional monitoring operates on a known-unknowns model: engineers anticipate what can go wrong, create dashboards and alerts for those scenarios, and investigate when thresholds are breached. This model works when systems are relatively simple and failure modes are predictable — a database runs out of disk space, a server’s CPU is saturated, a network link goes down.
Distributed systems break this model. A microservices architecture with dozens or hundreds of services, each with multiple instances, communicating through a mesh of synchronous and asynchronous interactions, produces failure modes that cannot be anticipated in advance. Latency increases because a downstream service’s garbage collection pauses coincide with a traffic spike, while a retry storm from an upstream caller amplifies the load. No engineer would create a dashboard for this specific scenario in advance, yet it manifests in production and degrades user experience.
Observability, as distinct from monitoring, provides the capability to understand system behaviour from its external outputs — metrics, logs, and traces — without needing to anticipate what questions to ask in advance. An observable system allows engineers to explore its behaviour, formulate hypotheses about why it is behaving unexpectedly, and validate or refute those hypotheses using the available telemetry data. The shift from monitoring to observability is the shift from checking predefined conditions to investigating emergent behaviour.
For the CTO, this shift has implications beyond tooling. It affects how teams operate, how incidents are managed, and how the organisation builds confidence in complex systems.
The Three Pillars and Their Integration
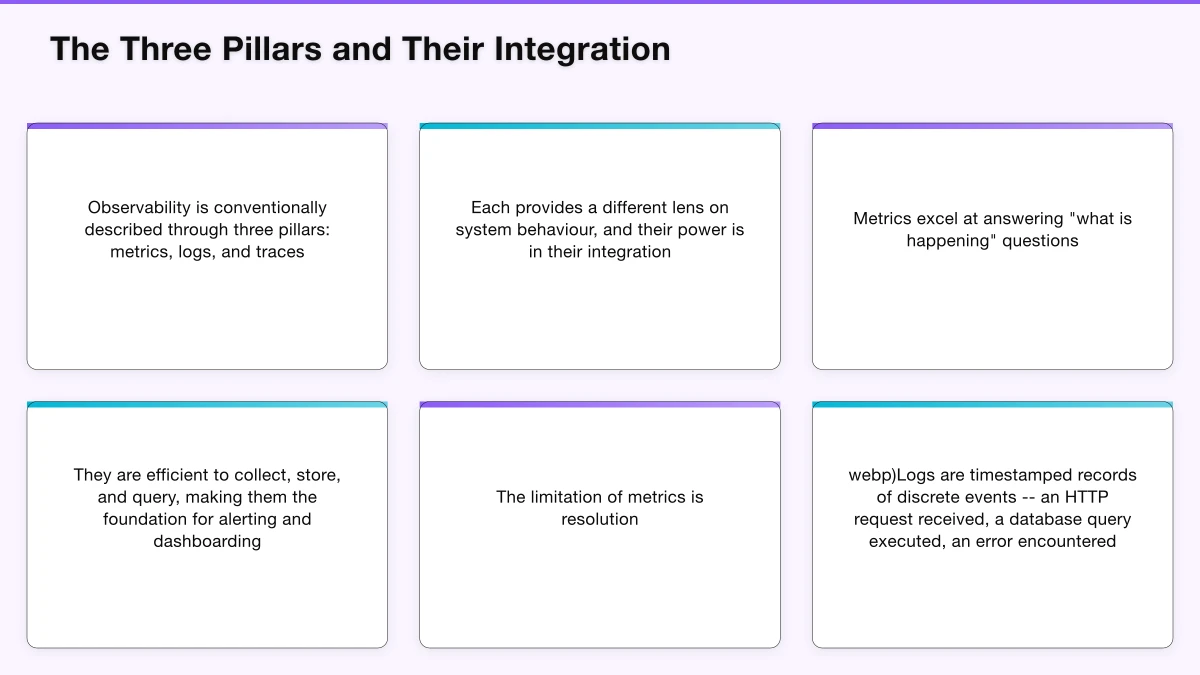
Observability is conventionally described through three pillars: metrics, logs, and traces. Each provides a different lens on system behaviour, and their power is in their integration.
Metrics are numerical measurements collected at regular intervals — request rate, error rate, latency percentiles, CPU utilisation, memory consumption, queue depth. Metrics excel at answering “what is happening” questions. They are efficient to collect, store, and query, making them the foundation for alerting and dashboarding. Prometheus has become the de facto standard for metrics collection in cloud-native environments, with its pull-based collection model, powerful query language (PromQL), and integration with Grafana for visualisation.
The limitation of metrics is resolution. Metrics are aggregated — a P99 latency metric tells you that 99% of requests completed within a certain time, but it does not tell you which specific requests were slow or why. Increasing metric cardinality (adding more labels to distinguish different request types, endpoints, or user segments) helps but creates storage and query performance challenges at scale.
Logs are timestamped records of discrete events — an HTTP request received, a database query executed, an error encountered. Logs provide the detailed context that metrics lack: the specific request parameters, the error message, the stack trace. But logs are expensive at scale. An enterprise generating terabytes of log data daily faces significant storage costs, and querying unstructured or semi-structured logs across large time ranges is slow. Structured logging — emitting logs in a consistent JSON format with standard fields — dramatically improves queryability and is a prerequisite for effective log-based investigation.
The Elastic Stack (Elasticsearch, Logstash/Fluentd, Kibana) remains the most widely deployed log management platform. Cloud-native alternatives — CloudWatch Logs, Azure Monitor Logs, Google Cloud Logging — provide managed infrastructure with cloud-specific integrations. Loki, from the Grafana project, offers a cost-effective alternative that indexes only log metadata (labels) and stores log content as compressed chunks, trading query flexibility for significantly lower storage costs.
Traces provide the distributed context that neither metrics nor logs provide independently. A distributed trace tracks a single request as it flows through multiple services, recording the timing and outcome of each operation. When a user reports that a specific action was slow, a trace reveals exactly which service or database query contributed the latency. Jaeger and Zipkin are the established open-source tracing platforms, and the OpenTelemetry project is standardising the instrumentation APIs and data formats that feed them.
The integration of these pillars is where observability delivers its greatest value. When a metric alert fires indicating elevated error rates, the engineer should be able to pivot from the metric to the corresponding logs (what errors are occurring?) and traces (which request paths are affected?). This pivot requires correlation: metrics, logs, and traces for the same request should share common identifiers (trace IDs, request IDs) that enable navigation between them. Achieving this correlation across an enterprise’s telemetry stack is a significant engineering investment but transformative for operational capability.
Implementing Observability at Enterprise Scale
Enterprise observability implementation must address instrumentation, infrastructure, and organisational challenges.
Instrumentation is the foundation. Every service must emit metrics, structured logs, and trace data. The OpenTelemetry project, now the standard for observability instrumentation, provides language-specific SDKs and auto-instrumentation agents that capture telemetry data with minimal code changes. For enterprises standardising on OpenTelemetry, the instrumentation becomes portable across backend platforms — the same instrumented code can send data to Jaeger, Prometheus, or any OpenTelemetry-compatible backend.
The platform team should provide instrumentation standards and libraries that product teams integrate into their services. These libraries should handle the boilerplate of metrics exposition, structured log formatting, and trace context propagation, allowing product teams to focus on application-specific instrumentation. The standard library should include common middleware that automatically instruments HTTP handlers, database clients, and message queue consumers.
Infrastructure scalability is a genuine challenge. Enterprise observability platforms must ingest, store, and query massive volumes of telemetry data. Metrics cardinality can reach millions of unique time series. Log volume can reach terabytes per day. Trace data, particularly for high-traffic services, can be equally voluminous. Storage tiering, sampling strategies, and retention policies must be designed to balance observability depth with cost.
Sampling is a critical technique for managing trace data volume at scale. Head-based sampling — deciding at the start of a request whether to trace it — is simple but risks missing interesting traces. Tail-based sampling — collecting all traces temporarily and then deciding which to retain based on their characteristics (errors, high latency, specific user segments) — is more sophisticated and ensures that interesting traces are always captured. The trade-off is implementation complexity and temporary storage requirements.
Organisational Adoption
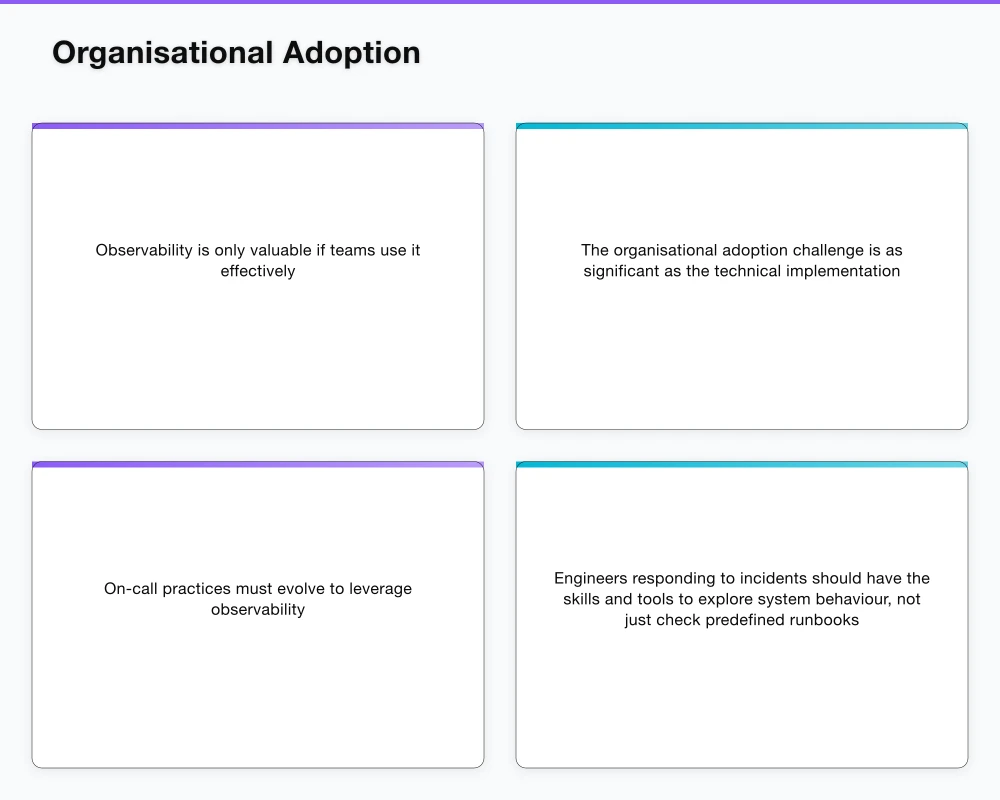
Observability is only valuable if teams use it effectively. The organisational adoption challenge is as significant as the technical implementation.
On-call practices must evolve to leverage observability. Engineers responding to incidents should have the skills and tools to explore system behaviour, not just check predefined runbooks. This requires training in the observability tooling and, more importantly, in the investigative mindset — formulating hypotheses, using telemetry to test them, and iterating toward root cause understanding.
Service level objectives (SLOs) provide the framework for using observability data to make operational decisions. An SLO defines the acceptable level of service — for example, 99.9% of requests should complete successfully within 200 milliseconds. The observability platform continuously measures actual performance against the SLO and calculates an error budget — the amount of unreliability the service can tolerate before the SLO is breached. Error budgets create a rational framework for balancing feature delivery velocity with reliability investment.
Blameless post-mortems use observability data to understand incidents objectively. Rather than asking “who caused this?” the investigation asks “what happened in the system?” — a question that observability data can answer with precision. The post-mortem process then identifies systemic improvements that reduce the likelihood of recurrence.
The cultural shift from alert-and-respond to explore-and-understand is gradual but profound. Teams that develop strong observability practices find that they spend less time fighting fires and more time understanding and improving their systems. For the CTO, investing in observability is investing in the organisation’s ability to operate complex systems with confidence — a capability that becomes more critical with every service added to the architecture.
The enterprises that build strong observability foundations today are building the operational capability that their increasingly complex architectures will demand tomorrow. This is not optional infrastructure — it is the nervous system of the modern enterprise technology stack.
Strategy without a web presence is invisible. Cosmos Web Tech publishes practical guides on building websites that attract and convert Australian customers.
Ash Ganda is the founder of Ganda Tech Services, a Sydney-based technology consultancy delivering cloud, web, and mobile solutions for Australian businesses.
About the Author
Ashish Ganda is the founder of Ganda Tech Services, a Sydney-based technology consultancy specialising in cloud infrastructure, web development, and mobile app solutions for Australian businesses.
Digital Transformation Roadmap 2026
A 12-month framework for Australian SMBs ready to modernise — phases, tools, and milestones.