Enterprise APM Strategy: Application Performance Monitoring for Modern Systems
Introduction
Application performance has always mattered. What has changed is the complexity of understanding it. Monolithic applications running on dedicated servers offered straightforward performance analysis. Modern distributed systems—microservices spanning multiple cloud providers, serverless functions, third-party APIs, and edge computing—create observability challenges that traditional monitoring cannot address.
For CTOs, APM investment decisions affect incident response capability, customer experience, engineering productivity, and ultimately business outcomes. The wrong approach creates visibility gaps and wasted tooling spend. The right approach transforms performance data into competitive advantage.
This guide examines how enterprise technology leaders should approach APM strategy, from understanding modern observability requirements to platform selection and operational excellence.
The Evolved APM Landscape
From Monitoring to Observability
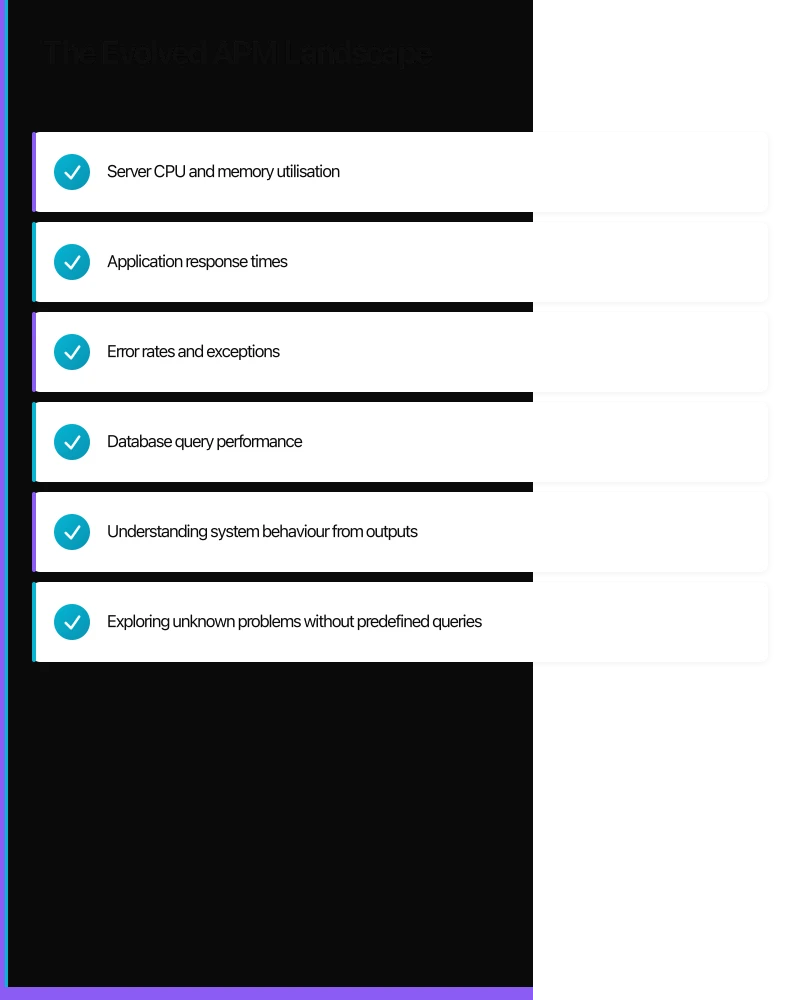
Traditional APM focused on predefined metrics and thresholds:
- Server CPU and memory utilisation
- Application response times
- Error rates and exceptions
- Database query performance
Modern observability encompasses:
- Understanding system behaviour from outputs
- Exploring unknown problems without predefined queries
- Correlating signals across distributed components
- Debugging production issues without reproduction
The shift from “monitoring what we expect” to “understanding what happens” reflects the unpredictable nature of complex distributed systems.
The Three Pillars (and Beyond)
The foundational observability signals:
Metrics
Numerical measurements over time:
- Request rates and latencies
- Resource utilisation
- Business KPIs
- Custom application metrics
Logs
Discrete event records:
- Application events
- Error details
- Audit trails
- Debug information
Traces
Request flow across services:
- End-to-end latency breakdown
- Service dependency mapping
- Error propagation tracking
- Performance bottleneck identification
Emerging Signals
Additional data sources gaining importance:
- Profiling: Continuous CPU and memory profiling
- Real User Monitoring (RUM): Actual user experience data
- Synthetic Monitoring: Proactive availability testing
- Session Replay: Visual user journey reconstruction
Enterprise Challenges
Large organisations face specific APM obstacles:
Scale
- Thousands of services and millions of requests
- Petabytes of observability data
- Global distribution across regions
- Cost management at scale
Complexity
- Heterogeneous technology stacks
- Multiple cloud providers
- Legacy and modern systems coexisting
- Third-party dependencies
Organisational
- Multiple teams with different needs
- Varied maturity levels
- Tool sprawl and fragmentation
- Skills gaps and training needs
Platform Architecture Decisions
Unified vs Best-of-Breed
The fundamental architectural decision:
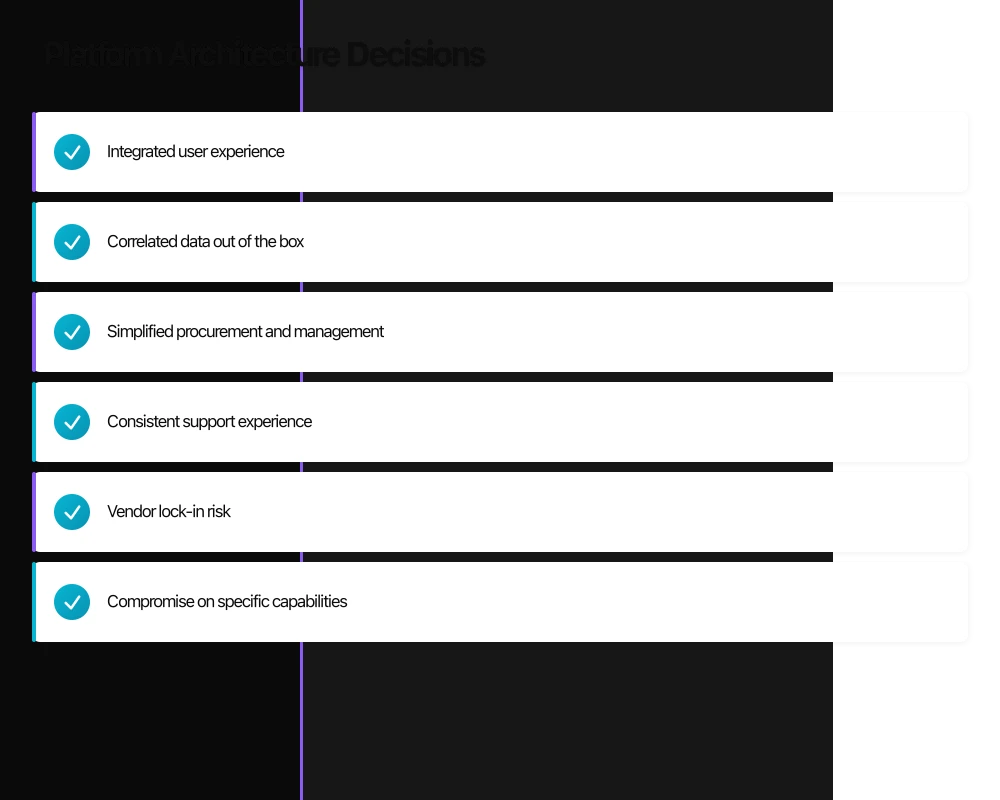
Unified Platform Approach
Single vendor for metrics, logs, traces, and more.
Advantages:
- Integrated user experience
- Correlated data out of the box
- Simplified procurement and management
- Consistent support experience
Disadvantages:
- Vendor lock-in risk
- Compromise on specific capabilities
- Single point of commercial dependency
Best-of-Breed Approach
Specialised tools for each observability pillar.
Advantages:
- Best capability for each function
- Flexibility to switch components
- Leverage existing investments
- Specialised features
Disadvantages:
- Integration complexity
- Multiple vendor relationships
- Context switching between tools
- Correlation challenges
Recommendation
Most enterprises benefit from a primary unified platform with selective best-of-breed additions for specific requirements. Pure best-of-breed creates operational overhead that rarely justifies capability differences.
OpenTelemetry Strategy
OpenTelemetry has become the standard instrumentation approach:
What OpenTelemetry Provides
- Vendor-neutral instrumentation APIs
- Standardised data formats
- Collector for processing and routing
- Growing language and framework support
Strategic Benefits
- Reduced vendor lock-in
- Consistent instrumentation approach
- Future-proofing investment
- Community-driven evolution
Implementation Considerations
- Not all vendors support equally
- Some proprietary features require vendor SDKs
- Collector adds infrastructure component
- Maturity varies by language
Recommendation
Adopt OpenTelemetry as the primary instrumentation standard. Accept vendor-specific instrumentation where OpenTelemetry gaps significantly impact capability.
Deployment Models
Where does observability infrastructure run?
SaaS (Vendor-Hosted)
Most common enterprise choice:
- Operational simplicity
- Elastic scalability
- Vendor manages infrastructure
- Higher per-unit costs at scale
Self-Hosted Commercial
Licensed software running on your infrastructure:
- Data residency control
- Potentially lower cost at scale
- Operational responsibility
- Capital expenditure model
Self-Hosted Open Source
Community tools on your infrastructure:
- No licensing costs
- Maximum flexibility
- Significant operational investment
- Limited commercial support
Hybrid
Combination approaches:
- Collectors on-premises, backend SaaS
- Primary SaaS, specific data self-hosted
- Multi-cloud with regional processing
Vendor Landscape
Commercial APM Platforms
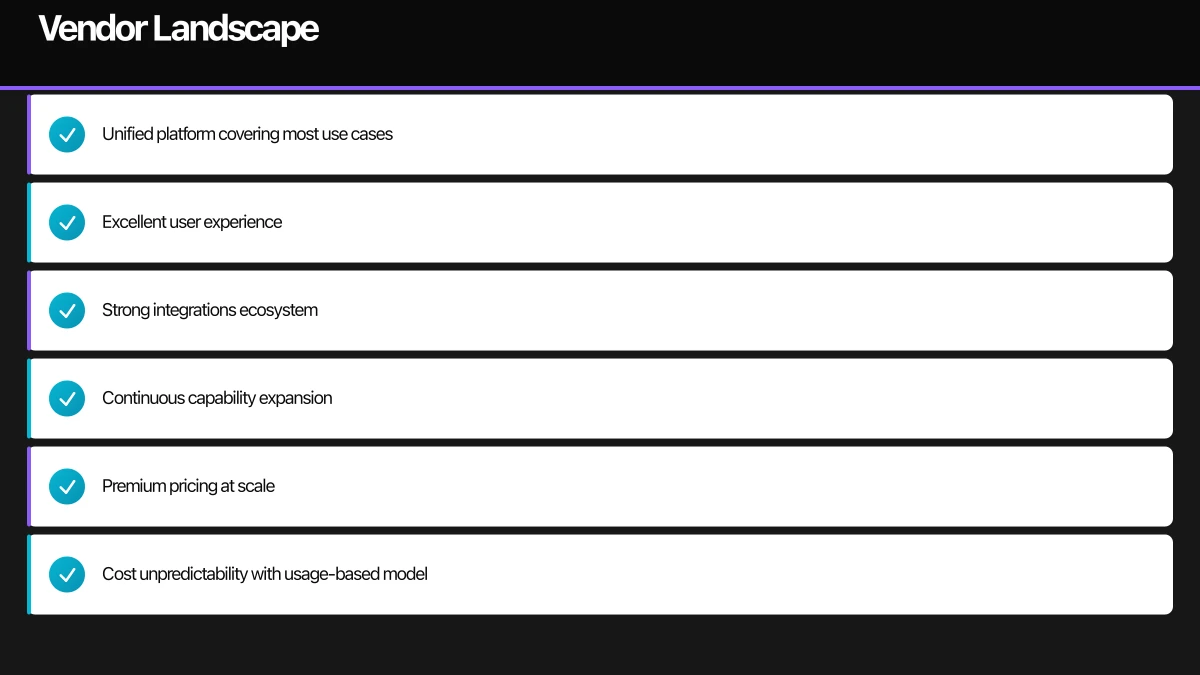
Datadog
Comprehensive observability platform with broad capabilities.
Strengths:
- Unified platform covering most use cases
- Excellent user experience
- Strong integrations ecosystem
- Continuous capability expansion
Considerations:
- Premium pricing at scale
- Cost unpredictability with usage-based model
- Feature sprawl complexity
Best for: Organisations prioritising capability breadth and user experience
New Relic
Long-established APM vendor with modernised platform.
Strengths:
- Strong APM heritage
- User-friendly interface
- Competitive pricing changes
- Full-stack observability
Considerations:
- Platform transition history
- Enterprise feature gaps versus Datadog
- Market position uncertainty
Best for: Organisations seeking value-oriented comprehensive APM
Dynatrace
AI-powered APM with strong enterprise features.
Strengths:
- Automated root cause analysis
- Enterprise security and compliance
- Strong mainframe and legacy support
- Sophisticated AI capabilities
Considerations:
- Higher complexity
- Premium enterprise pricing
- Opinionated approach may not fit all
Best for: Large enterprises with complex, heterogeneous environments
Splunk Observability
Observability suite from data platform leader.
Strengths:
- Integration with Splunk platform
- Strong infrastructure monitoring heritage
- Established enterprise relationships
- OpenTelemetry commitment
Considerations:
- Platform integration complexity
- Pricing model transitions
- Multiple product consolidation ongoing
Best for: Existing Splunk customers seeking observability expansion
Elastic Observability
Observability on the Elastic stack.
Strengths:
- Self-hosted option available
- Strong log analysis heritage
- Cost-effective at scale (self-hosted)
- OpenTelemetry support
Considerations:
- Operational complexity for self-hosted
- APM capabilities less mature than specialists
- Licensing model changes
Best for: Organisations with Elastic expertise seeking unified observability
Cloud-Native Options
AWS CloudWatch and X-Ray
AWS-native observability:
- Deep AWS service integration
- No additional vendor relationship
- Limited cross-cloud capability
- Basic compared to specialists
Azure Monitor and Application Insights
Microsoft’s observability offering:
- Azure-native integration
- Strong .NET support
- Improving capabilities
- Azure ecosystem lock-in
Google Cloud Operations
GCP observability suite:
- GCP-native integration
- Strong for GKE and serverless
- Growing capability set
- GCP-centric
Best for: Single-cloud organisations prioritising native integration over capability depth
Open Source Options
Grafana Stack (Prometheus, Loki, Tempo, Grafana)
Popular open-source combination:
- No licensing costs
- Active community
- Grafana Cloud as managed option
- Operational investment required
Jaeger
Open-source distributed tracing:
- CNCF graduated project
- Production-proven
- Focused on tracing only
- Requires additional tools for complete observability
OpenSearch
AWS fork of Elasticsearch with observability capabilities:
- Log analysis strength
- Growing observability features
- Self-hosted or managed
- Evolving post-fork
Evaluation Framework
Requirements Assessment
Before evaluation, clarify needs:
Technical Scope
- Languages and frameworks in use
- Cloud providers and services
- Container and orchestration platforms
- Legacy systems requiring coverage
Functional Requirements
- Tracing depth and capabilities
- Log management needs
- Metric cardinality expectations
- RUM and synthetic requirements
Operational Requirements
- Data retention periods
- Query performance expectations
- Integration requirements
- Compliance and security needs
Scale Parameters
- Expected data volumes
- User count and roles
- Global distribution needs
- Growth projections
Evaluation Criteria
| Criteria | Weight | Considerations |
|---|---|---|
| Coverage | High | Support for your stack |
| Usability | High | Time to insight, learning curve |
| Integration | Medium | Ecosystem connectivity |
| Scalability | Medium | Performance at your scale |
| Pricing | High | TCO at current and projected scale |
| Support | Medium | Enterprise support quality |
| Roadmap | Low | Future direction alignment |
Proof of Concept Design
Structure POCs for meaningful comparison:
Environment Selection
- Representative application subset
- Mix of technologies
- Realistic production characteristics
- Controlled comparison conditions
Evaluation Scenarios
- Instrumentation deployment
- Dashboard creation
- Alert configuration
- Incident investigation simulation
- Cross-service trace analysis
Success Metrics
- Time to instrument
- Time to first dashboard
- Query performance
- User satisfaction scores
- Total cost projection
Implementation Excellence
Instrumentation Strategy
Comprehensive instrumentation without overwhelming:
Automatic Instrumentation
Start with agent-based automatic coverage:
- Rapid initial visibility
- Standard framework support
- Lower engineering investment
- Foundation for custom additions
Custom Instrumentation
Add targeted instrumentation for:
- Business-critical transactions
- Custom frameworks or libraries
- Domain-specific metrics
- High-value traces
Instrumentation Standards
Establish organisational standards:
- Naming conventions for metrics and spans
- Required attributes and tags
- Cardinality guidelines
- Performance overhead limits
Data Management
Control observability data effectively:
Sampling Strategies
Not all data needs full resolution:
- Head-based sampling: Decide at trace start
- Tail-based sampling: Keep interesting traces
- Adaptive sampling: Adjust based on volume
- Error-preserving: Always keep errors
Retention Policies
Balance insight needs with cost:
- Hot storage for recent, frequent queries
- Warm storage for investigation needs
- Cold storage for compliance requirements
- Automated lifecycle management
Cardinality Management
High cardinality creates cost and performance issues:
- Metric label guidelines
- Trace attribute limits
- Log field standardisation
- Alerting on cardinality explosion
Alert Management
Transform data into actionable alerts:
Alert Strategy
Define alerting philosophy:
- Alert on symptoms, not causes
- Page on customer-impacting issues
- Ticket for degradation trends
- Log for investigation data
Alert Quality
Measure and improve alert effectiveness:
- Alert fatigue monitoring
- False positive tracking
- Response time measurement
- Regular alert review and pruning
Escalation Procedures
Clear paths from alert to resolution:
- On-call rotation integration
- Escalation timing and criteria
- Runbook linkage
- Post-incident review
Dashboard Design
Effective visualisation for different audiences:
Operational Dashboards
Real-time system health:
- Key health indicators
- Service status overview
- Error rate trends
- Resource utilisation
Service Dashboards
Team-specific deep dives:
- Service-level objectives
- Dependency health
- Performance distributions
- Error breakdowns
Executive Dashboards
Business-focused views:
- Customer experience metrics
- Availability trends
- Capacity utilisation
- Cost efficiency
Operational Maturity
SLO-Based Operations
Move from reactive to proactive:
Define SLOs
Clear service level objectives:
- Availability targets (99.9%, 99.95%, etc.)
- Latency targets (p50, p95, p99)
- Error rate thresholds
- Business-specific metrics
Error Budget Management
Operationalise SLO compliance:
- Track error budget consumption
- Alert on budget burn rate
- Connect to release decisions
- Balance reliability and velocity
Incident Response Integration
APM as incident response foundation:
Detection
- SLO-based alerting
- Anomaly detection
- Correlation of signals
- Proactive issue identification
Investigation
- Trace-based root cause analysis
- Log correlation
- Metric exploration
- Historical comparison
Resolution
- Impact scope determination
- Change correlation
- Rollback decision support
- Communication data
Learning
- Post-incident timeline reconstruction
- Root cause documentation
- Improvement identification
- Metric-based verification
Performance Engineering
Proactive performance optimisation:
Continuous Profiling
Always-on production profiling:
- CPU hotspot identification
- Memory allocation analysis
- Lock contention detection
- Performance regression detection
Capacity Planning
Data-driven resource planning:
- Utilisation trend analysis
- Growth projection modelling
- Seasonal pattern recognition
- Cost optimisation opportunities
Performance Testing Integration
Connect testing with production monitoring:
- Baseline comparison
- Regression detection
- Load testing analysis
- Production validation
Cost Management
Understanding APM Costs
APM platforms typically charge by:
- Host or container count
- Data ingestion volume
- User seats
- Retention duration
- Feature tiers
Costs can escalate rapidly without governance.
Cost Optimisation Strategies
Data Reduction
- Sampling for high-volume, low-value data
- Aggregation at collection
- Filtering noise before ingestion
- Compression and deduplication
Retention Optimisation
- Tiered retention by data type
- Automated archival and deletion
- Compliance-driven, not default-driven
- Regular retention review
Architecture Efficiency
- Collector deployment optimisation
- Query efficiency improvement
- Dashboard consolidation
- Alert rationalisation
Commercial Negotiation
- Volume commitments for discounts
- Multi-year agreements where appropriate
- Feature tier optimisation
- Competitive leverage
Cost Visibility
Track and allocate APM costs:
- Per-team cost allocation
- Per-service cost tracking
- Budget alerts and controls
- Regular cost review meetings
Conclusion
APM has evolved from a nice-to-have monitoring tool to essential infrastructure for operating complex distributed systems. The platforms selected and practices implemented today determine incident response capability, engineering productivity, and ultimately customer experience.
The path forward requires balancing capability needs with operational simplicity and cost efficiency. Unified platforms offer integration benefits; open standards like OpenTelemetry provide flexibility. The right choice depends on organisational scale, technical complexity, and strategic priorities.
Success lies not just in tool selection but in operational maturity: effective instrumentation, meaningful alerting, clear SLOs, and integration with incident response and performance engineering practices.
Invest in observability as a capability, not just a tool purchase. The returns in faster incident resolution, proactive performance optimisation, and confident system operation justify the investment.
Sources
- Gartner. (2025). Magic Quadrant for Application Performance Monitoring and Observability. Gartner Research.
- CNCF. (2025). OpenTelemetry Specification. https://opentelemetry.io/docs/specs/
- Google. (2024). Site Reliability Engineering: Monitoring Distributed Systems. O’Reilly Media.
- Majors, C., Fong-Jones, L., & Miranda, G. (2022). Observability Engineering. O’Reilly Media.
Strategic guidance for technology leaders building comprehensive observability capabilities.
Need to put cloud strategy into action? Cloud Geeks provides in-depth guides on AWS, Azure, and cybersecurity for Australian SMBs.
These insights are drawn from my work leading Ganda Tech Services — helping Australian businesses navigate digital transformation through cloud, web, and mobile.
About the Author
Ashish Ganda is the founder of Ganda Tech Services, a Sydney-based technology consultancy specialising in cloud infrastructure, web development, and mobile app solutions for Australian businesses.
Digital Transformation Roadmap 2026
A 12-month framework for Australian SMBs ready to modernise — phases, tools, and milestones.