Enterprise Logging Architecture: ELK vs Cloud-Native Solutions
Centralised logging is a non-negotiable capability for enterprise technology operations. When systems are distributed across microservices, containers, and cloud regions, the ability to search, correlate, and analyse logs from across the entire estate is essential for incident investigation, performance analysis, security monitoring, and compliance auditing. Without centralised logging, debugging a production issue becomes an exercise in ssh-ing into individual servers and grepping through files — an approach that is untenable at enterprise scale.
The enterprise logging landscape offers two broad architectural approaches: the self-managed Elastic Stack (formerly ELK — Elasticsearch, Logstash, Kibana) and cloud-native logging services (AWS CloudWatch Logs, Google Cloud Logging, Azure Monitor Logs, and commercial platforms like Datadog and Splunk). The choice between these approaches involves strategic trade-offs in cost, operational complexity, capability, and vendor dependency that deserve careful analysis.
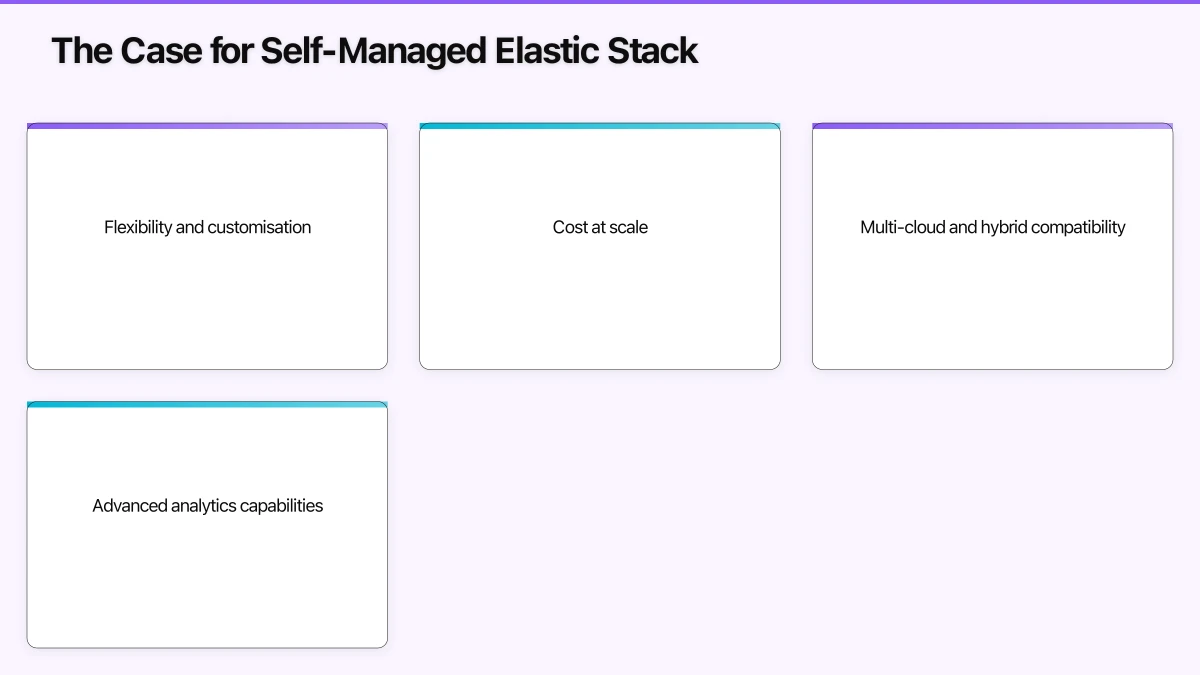
The Case for Self-Managed Elastic Stack
The Elastic Stack has been the dominant open source logging platform for most of the past decade. Elasticsearch provides the search and analytics engine, Logstash (or increasingly Fluentd/Fluent Bit) provides log collection and transformation, and Kibana provides the visualisation and search interface. The stack is powerful, flexible, and proven at massive scale.
Flexibility and customisation is the primary advantage of self-managed Elastic. The organisation controls the entire stack: index patterns, retention policies, search tuning, cluster topology, and security configuration. Complex log processing pipelines can be built with Logstash filters or Elasticsearch ingest pipelines, transforming, enriching, and routing logs in ways that may not be possible with more opinionated managed services.
Cost at scale can favour self-managed Elastic for organisations with large log volumes. Cloud-native logging services typically charge per gigabyte ingested and stored, and at enterprise scale (terabytes per day), these costs can be substantial. Self-managed Elastic on appropriately sized infrastructure can achieve lower per-gigabyte costs, particularly when using hot-warm-cold architectures that move older logs to less expensive storage tiers.
Multi-cloud and hybrid compatibility makes the Elastic Stack cloud-agnostic. Organisations operating across AWS, Azure, GCP, and on-premises infrastructure can centralise all logs in a single Elastic cluster regardless of source. Cloud-native logging services are inherently provider-specific, creating logging silos in multi-cloud environments.
Advanced analytics capabilities in Elasticsearch include full-text search with relevance scoring, aggregation pipelines for statistical analysis, machine learning-based anomaly detection (in the paid tier), and alerting based on complex query conditions. These capabilities support sophisticated use cases like security information and event management (SIEM), business analytics on log data, and proactive anomaly detection.
The limitations of self-managed Elastic are primarily operational. Running an Elasticsearch cluster at enterprise scale requires significant expertise in cluster management, capacity planning, index lifecycle management, and performance tuning. Undersized clusters degrade search performance; misconfigured retention policies exhaust disk space; shard management issues create hot spots. The operational burden is substantial and ongoing.
Elastic’s licensing changes in early 2021 — switching from Apache 2.0 to the Server Side Public License (SSPL) and Elastic License — created strategic uncertainty for enterprise users. The OpenSearch fork (maintained by AWS) provides a community-governed alternative, but the ecosystem fragmentation introduces complexity for organisations making long-term technology commitments.
The Case for Cloud-Native Logging
Cloud-native logging services eliminate the operational burden of managing logging infrastructure in exchange for per-use pricing and provider-specific capabilities.
AWS CloudWatch Logs provides log ingestion, storage, search, and alerting integrated with the AWS ecosystem. Lambda functions, ECS containers, EC2 instances, and API Gateway all send logs to CloudWatch by default, with minimal configuration. CloudWatch Insights provides a query language for searching and analysing log data. For AWS-centric organisations, CloudWatch Logs provides adequate logging with minimal operational investment.
CloudWatch’s limitations include its search capabilities (powerful but less flexible than Elasticsearch), its cross-account and cross-region querying complexity, and its cost at high volumes. For organisations ingesting hundreds of gigabytes daily, CloudWatch Logs costs can exceed what self-managed Elastic would cost on equivalent infrastructure.
Google Cloud Logging (formerly Stackdriver) provides similar capabilities within the GCP ecosystem, with strong integration with Kubernetes (GKE automatically ships container logs), BigQuery integration for advanced analysis, and log-based metrics for monitoring. Google’s logging query language is capable but differs from the Elasticsearch query syntax that many engineers are familiar with.
Commercial logging platforms like Datadog, Splunk, and Sumo Logic provide managed logging with advanced capabilities: machine learning-based anomaly detection, distributed tracing correlation, security analytics, and multi-cloud aggregation. These platforms command premium pricing but deliver capabilities that self-managed or cloud-native solutions require significant effort to replicate.
Datadog has gained particular traction in enterprise environments by combining logging with metrics, tracing, and security monitoring in a single platform. The unified observability experience — correlating a spike in error logs with a degradation in request latency and tracing it to a specific service deployment — provides operational value that standalone logging solutions cannot match.
Architecture Decisions for Enterprise Logging
Regardless of the platform choice, several architectural decisions shape the effectiveness of enterprise logging.
Log format standardisation ensures that logs from different services can be searched and correlated consistently. Structured logging (JSON-formatted log entries with consistent field names) is essential for enterprise-scale log analysis. Fields like timestamp, service name, request ID, user ID, and severity should be standardised across all services. Unstructured text logs are human-readable but machine-hostile, making aggregation and search inefficient.
Correlation identifiers enable tracing a single business transaction across multiple services. A request ID generated at the entry point and propagated through all downstream service calls allows operators to search for all log entries related to a specific transaction. In microservice architectures, this correlation is essential for debugging issues that span service boundaries.
Log levels and volume management prevent log data from overwhelming the logging infrastructure. Enterprise applications should use log levels consistently: ERROR for conditions requiring immediate attention, WARN for unusual conditions that do not prevent operation, INFO for significant business events, and DEBUG for detailed diagnostic information. Production environments should typically run at INFO level, with the ability to dynamically increase to DEBUG for specific services during investigation.
The volume implications are significant. A service logging at DEBUG level may produce 10-100x the volume of INFO-level logging. At enterprise scale, this difference translates to terabytes of additional daily volume and corresponding cost increases. Dynamic log level management — increasing verbosity for specific services during incidents and returning to normal afterward — is an essential operational capability.
Retention strategy should align with business, operational, and compliance requirements. Hot storage (immediately searchable) is typically retained for 7-30 days. Warm storage (searchable with some latency) extends to 90 days. Cold storage (archived, requiring restoration before search) extends to one year or more for compliance purposes. Different log categories may warrant different retention: security logs retained for years, application debug logs for days.
Log pipeline architecture should separate collection from processing from storage. Fluent Bit (lightweight, suitable for container sidecars and edge collection) or Fluentd (more capable, suitable for aggregation and transformation) collect logs from application instances. A processing layer enriches, transforms, and routes logs to appropriate destinations. The storage layer receives processed logs for indexing and retention.
This separation enables routing different log types to different destinations: security-relevant logs to the SIEM, application logs to the operational logging platform, and audit logs to long-term archival storage. It also enables changing any layer independently — replacing the collection agent, adding new processing rules, or migrating to a different storage backend.
Making the Decision
The choice between self-managed Elastic, cloud-native services, and commercial platforms depends on organisational context.
Self-managed Elastic suits organisations with strong infrastructure engineering teams, high log volumes where cost management is important, multi-cloud or hybrid environments requiring a cloud-agnostic platform, and advanced analytics requirements that benefit from Elasticsearch’s capabilities.
Cloud-native services suit organisations committed to a single cloud provider, prioritising operational simplicity over capability depth, with moderate log volumes where per-use pricing is acceptable, and preferring managed services across the technology stack.
Commercial platforms suit organisations willing to pay premium pricing for advanced capabilities, wanting unified observability (logs, metrics, traces) in a single platform, lacking the engineering capacity to manage logging infrastructure, and requiring capabilities like ML-based anomaly detection and security analytics.
Conclusion
Enterprise logging architecture is a strategic investment that underpins operational excellence, security monitoring, and compliance readiness. The technology landscape offers viable options across the self-managed, cloud-native, and commercial spectrum, each optimising for different organisational priorities.
For CTOs evaluating logging strategy in 2022, the critical success factors are consistent log format standards, correlation identifiers for cross-service tracing, volume management to control costs, and retention policies aligned with business requirements. The platform choice matters, but these architectural practices determine whether the logging capability delivers value regardless of the underlying technology.
For technical deep-dives on the cloud and IT topics I cover strategically, visit Cloud Geeks — our specialist IT infrastructure blog.
Ganda Tech Services is my technology consultancy, bringing together cloud infrastructure, web development, and mobile expertise for Australian businesses.
About the Author
Ashish Ganda is the founder of Ganda Tech Services, a Sydney-based technology consultancy specialising in cloud infrastructure, web development, and mobile app solutions for Australian businesses.
Tech Stack Selection Guide 2026
Choose the right tools for your Australian business — without the vendor hype or overlapping spend.