Embracing Analytics-Driven Change and Design Thinking in Business
Introduction
Airbnb faced a critical problem in 2009. Despite launching two years earlier, the platform was barely growing. The team had data showing poor booking rates but couldn’t figure out why. Then they combined design thinking observation with analytics—actually visiting hosts and examining listings. What they discovered changed everything.
The data showed low conversion rates on certain listings, but design thinking revealed why: terrible photos. Hosts were using smartphone pictures with poor lighting. Airbnb rented professional cameras, photographed listings in key cities, and tracked the results. Bookings in photographed homes doubled. Revenue jumped from $200/week to $400/week per listing, according to Brian Chesky’s documented account.
This combination—analytics identifying problems, design thinking understanding human context, then measuring results—represents a powerful innovation framework. Research from McKinsey shows companies using both approaches together achieve 2.5x higher innovation success rates than those using either alone.
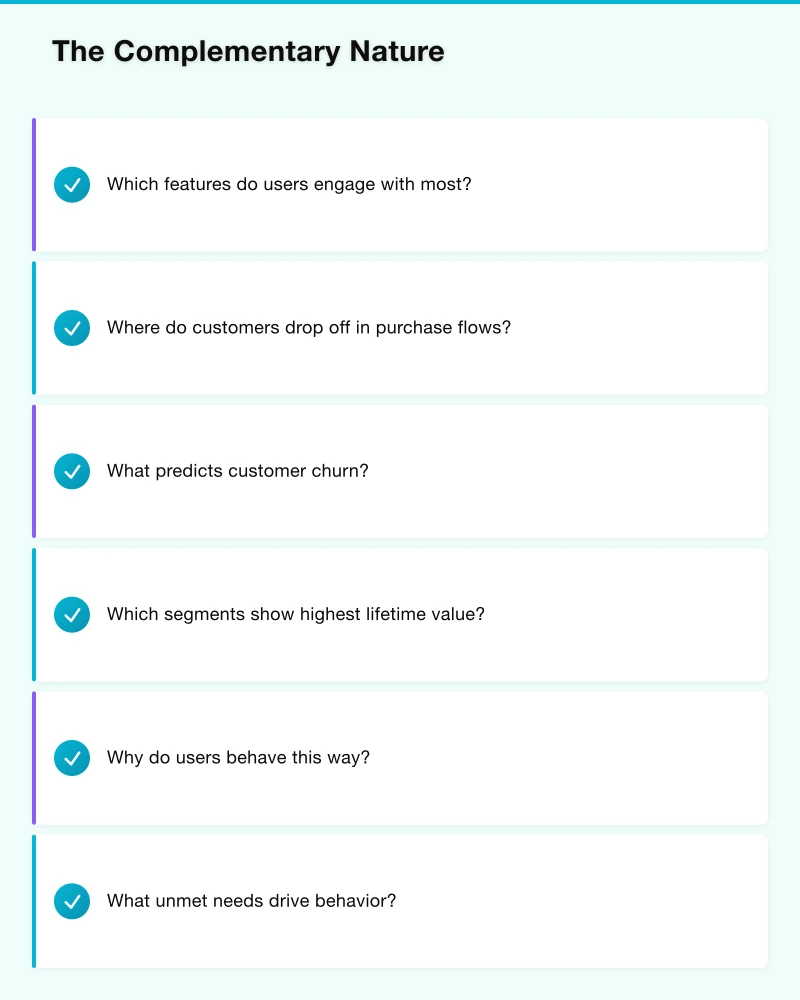
The Complementary Nature
Analytics Reveals What Happens
Analytics provides the “what”—measurable patterns, trends, correlations. It answers:
- Which features do users engage with most?
- Where do customers drop off in purchase flows?
- What predicts customer churn?
- Which segments show highest lifetime value?
Forrester’s 2024 data culture research found 83% of companies now use analytics for business decisions—but analytics alone doesn’t explain why patterns exist or what solutions will work.
Design Thinking Reveals Why and How
Design thinking developed at Stanford’s d.school and popularized by IDEO provides the “why” and “how”—human context and solution creation. According to Stanford d.school’s framework, it answers:
- Why do users behave this way?
- What unmet needs drive behavior?
- How might we solve this differently?
- What solutions resonate with actual humans?
IBM’s design thinking impact study tracked projects using their approach: 75% faster time to market and 2x ROI compared to traditional development.
Combined They Drive Validated Innovation
Together, these approaches create a virtuous cycle:
- Analytics identifies opportunities - Data shows where problems or potential exist
- Design thinking explores context - Human research reveals why and for whom
- Ideation generates solutions - Creative problem-solving proposes answers
- Analytics validates impact - Measurement proves what actually works
Research from the Design Management Institute found design-led companies combining analytics outperformed the S&P 500 by 219% over 10 years.
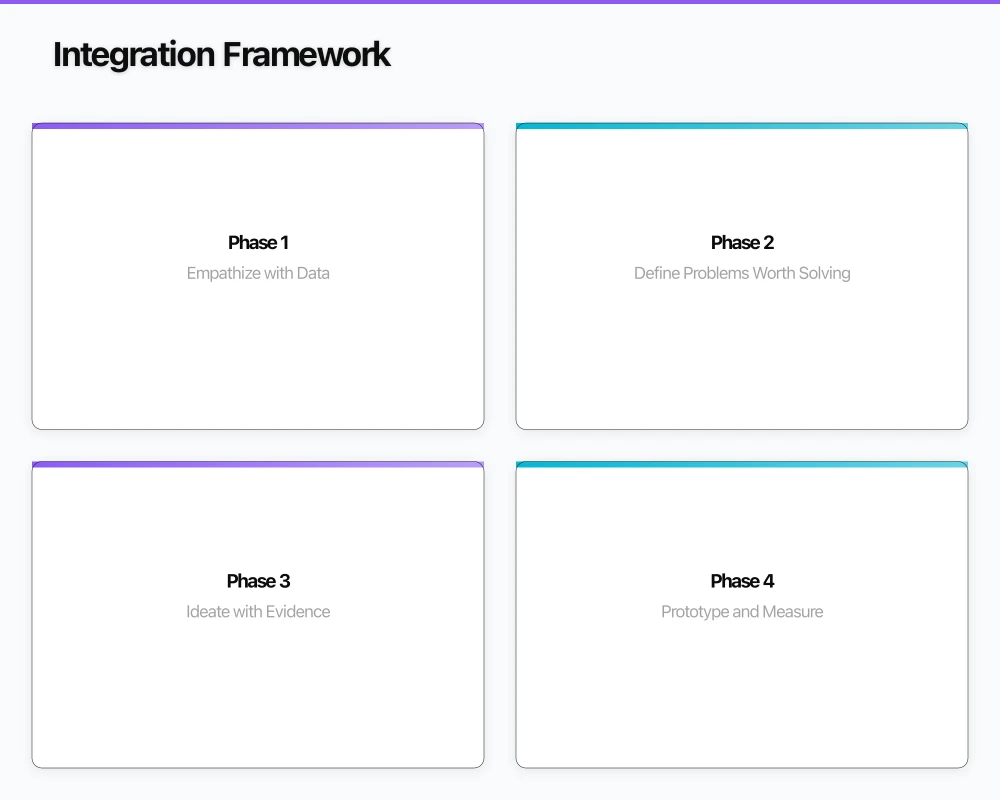
Integration Framework
Phase 1: Empathize with Data
Traditional design thinking starts with user observation. Analytics-driven design thinking starts with data revealing behavior patterns, then uses empathy research to understand why.
Example: Spotify noticed (via analytics) that users who created playlists within 24 hours were 3x more likely to remain subscribers. Design thinking research revealed why: active curation made users feel invested. This insight shaped onboarding to emphasize playlist creation immediately, according to Spotify’s engineering blog.
Tools: Behavioral analytics platforms (Amplitude, Mixpanel), user journey mapping combining quantitative flow data with qualitative interviews.
Phase 2: Define Problems Worth Solving
Use analytics to prioritize which problems matter most, then design thinking to frame them correctly. IDEO’s design thinking guide emphasizes defining the right problem is half the solution.
Example: Intuit analyzed customer support data showing tax software frustration peaks at specific workflow steps. Design research revealed these weren’t bugs—they were fundamental conceptual misunderstandings about tax logic. According to Intuit’s innovation reports, reframing the problem from “fix workflow bugs” to “help users understand tax concepts” led to solutions that reduced support calls by 35%.
Tools: Problem prioritization matrices combining business impact data (revenue effect, customer volume) with design thinking’s “desirability, feasibility, viability” framework.
Phase 3: Ideate with Evidence
Generate creative solutions informed by data patterns. Analytics reveals constraints and opportunities; design thinking expands solution space.
Example: Fidelity’s design research combined analytics (showing users rarely checked retirement accounts) with ethnographic research (revealing anxiety about insufficient savings). Rather than just adding notifications (analytics solution) or simplifying interfaces (design solution), they created “small steps” microinvestment features that analytics showed increased engagement by 52%.
Methods: Brainstorming sessions starting with data insights, rapid prototyping guided by user feedback and A/B test results, concept testing measuring both emotional response and behavioral metrics.
Phase 4: Prototype and Measure
Build testable versions with clear metrics. Design thinking’s “fail fast” meets analytics’ “measure everything.”
According to Google’s HEART framework for measuring UX, successful prototypes track five metrics: Happiness (satisfaction), Engagement (usage), Adoption (new users), Retention (returning users), Task Success (completion rates).
Example: Booking.com runs thousands of A/B tests annually, combining design variations with statistical analysis. Their engineering team reports testing everything from button colors to entire booking flows, with data determining winners. This approach helped them achieve 15% year-over-year conversion improvements.
Tools: Rapid prototyping tools (Figma, InVision) integrated with analytics platforms, multivariate testing frameworks, user testing combined with behavior tracking.
Phase 5: Iterate Based on Combined Feedback
Refine using both quantitative metrics (analytics) and qualitative insights (design research). Lean Startup methodology formalized this as “build-measure-learn.”
Example: Instagram’s Explore tab evolved through 30+ iterations combining usage analytics (click-through rates, time spent) with user research (why certain content resonated). Instagram’s product team documented how each iteration improved engagement metrics while better serving user needs their research revealed.
Practical Applications
Product Development
Combining approaches transforms how products get built. Harvard Business Review research found products developed using both analytics and design thinking have 42% higher user satisfaction and 31% better retention.
Application: Netflix uses viewing analytics to identify content gaps, then design thinking to understand viewing context (family viewing, binge-watching, background watching). This informs both content acquisition and interface design. Their recommendation system combines machine learning (analytics) with human curation (design thinking), driving 80% of viewing.
Customer Experience Transformation
Analytics maps the current experience; design thinking envisions the ideal experience; combined approaches bridge the gap.
Forrester’s customer experience research found companies excelling at both analytics and design thinking achieve Net Promoter Scores 2x higher than average.
Application: Bank of America’s “Keep the Change” program emerged from ethnographic research revealing people struggle saving (design thinking) combined with transaction data analysis showing micro-amounts go unnoticed (analytics). The program rounds purchases to the nearest dollar and saves the difference. Results: 12 million customers enrolled, $2 billion saved.
Process Improvement
Analytics identifies inefficient processes; design thinking reimagines how work could flow; measurement validates improvements.
MIT Sloan research on process innovation shows 3x faster implementation when combining approaches versus traditional process reengineering.
Application: Kaiser Permanente redesigned nurse shift changes using design thinking (shadowing nurses, understanding pain points) combined with operational analytics (handoff error rates, patient wait times). Published results showed 50% fewer errors and 12% faster nurse workflows.
Success Factors
Balance Intuition with Data
Data reveals patterns but can’t interpret meaning. Human insight provides context but needs validation. Research from Wharton found the best decisions combine both.
Practice: Amazon’s “disagree and commit” culture allows design instinct to override data temporarily, but requires measurement to prove intuition correct. Jeff Bezos’ shareholder letters document cases where data suggested one path but customer insight suggested another—and measurement determined the winner.
Start with Human Understanding
Don’t let data create empathy-free solutions. Stanford d.school research emphasizes always starting with real human needs.
Practice: Procter & Gamble’s “Living It” program requires product managers to live with customers, experiencing products in context. They then use analytics to scale insights discovered during immersion.
Test Assumptions Rigorously
Both qualitative insights and quantitative patterns can mislead. Test everything. Google Ventures’ design sprint methodology builds in weekly validation cycles combining user testing and metrics.
Measure What Actually Matters
Vanity metrics mislead. Focus on metrics tied to real business outcomes and user value. Lean Analytics framework provides guidance on identifying meaningful metrics for different business models.
Organizational Enablers
According to McKinsey’s organizational analytics research, successful integration requires specific organizational capabilities.
Cross-Functional Teams: Combine data scientists, designers, product managers, and engineers. Spotify’s squad model embeds analytics and design skills in autonomous teams.
Data Accessibility: Make data available to designers and design insights available to analysts. Mode Analytics’ benchmark study shows self-service analytics adoption correlates with 40% faster innovation cycles.
Creative Culture: Value both rigor and imagination. Pixar’s Braintrust meetings combine creative feedback with data on what audiences respond to.
Experimentation Mindset: Accept that many ideas will fail, but learning from failure using measurement improves odds. Booking.com’s culture of experimentation runs 25,000+ tests annually, with 90% “failing”—but the 10% that succeed drive significant business impact.
Conclusion
Neither analytics nor design thinking alone creates sustainable innovation. Analytics without design thinking produces data-rich but empathy-poor solutions that technically work but people don’t want. Design thinking without analytics creates user-loved ideas that don’t scale or can’t be measured.
Together, they form what IDEO and McKinsey’s joint research calls “informed intuition”—creativity grounded in reality and ideas validated by evidence.
Airbnb’s success came from neither pure data analysis nor pure design instinct, but the combination revealing insights neither alone could provide. That’s the power of embracing both: analytics-driven change guided by design thinking, and human-centered design validated by analytics.
Organizations mastering this integration don’t just respond to market changes—they anticipate and shape them.
Sources
- First Round Review - Airbnb Design Thinking Story - 2014
- McKinsey - Analytics in Marketing and Sales - 2024
- Forrester - Data Culture Research - 2024
- Stanford d.school - Design Thinking Framework - 2023
- IBM - Design Thinking Impact Study - 2024
- Design Management Institute - Design Value Report - 2023
- Harvard Business Review - Design Thinking and Data Analytics - 2023
- Google - HEART Framework for UX Measurement - 2020
- Forrester - Customer Experience Business Impact - 2024
- MIT Sloan - Combining Analytics and Design Thinking - 2023
- McKinsey - Building Analytics Capabilities - 2024
Learn more about innovation methodologies.
Learn more about innovation methodologies.
Strategy needs execution. Cloud Geeks publishes practical cloud computing and cybersecurity guides for Australian businesses ready to act.
Ash Ganda is the founder of Ganda Tech Services, a Sydney-based technology consultancy delivering cloud, web, and mobile solutions for Australian businesses.
About the Author
Ashish Ganda is the founder of Ganda Tech Services, a Sydney-based technology consultancy specialising in cloud infrastructure, web development, and mobile app solutions for Australian businesses.
Digital Transformation Roadmap 2026
A 12-month framework for Australian SMBs ready to modernise — phases, tools, and milestones.