
Integrating Analytics Maturity with Design Thinking: A Pathway to Business Innovation
Introduction
A retail executive faced a frustrating paradox in 2023: her company had invested $15 million building a sophisticated analytics platform with predictive modeling capabilities, yet product teams continued making decisions based on intuition and anecdotal feedback. Meanwhile, a competing retailer with basic analytics but strong design thinking practices launched three successful products in the same period, each grounded in customer insights.
According to Gartner’s 2024 Analytics Survey, 87% of organizations report low analytics maturity levels, while McKinsey research shows that 70% of design thinking initiatives fail to scale beyond pilot projects. The problem? Most organizations treat analytics and innovation as separate capabilities when they should be integrated.
Analytics maturity frameworks assess an organization’s ability to extract value from data—progressing from basic reporting to sophisticated predictive and prescriptive analytics. Design thinking provides a human-centered innovation methodology for solving complex problems through empathy, experimentation, and iteration. Integrating these approaches creates a powerful capability: evidence-based creativity.
Research from MIT Sloan Management Review demonstrates that organizations successfully combining analytical rigor with design thinking principles achieve 2.5× higher innovation success rates than those relying exclusively on one approach. This integration represents the future of business innovation—grounding creative problem-solving in data while ensuring analytics serves genuine human needs.
Understanding Analytics Maturity
Maturity Levels Explained
Gartner’s Analytics Maturity Model defines five progressive stages organizations traverse as they develop analytical capabilities:
1. Descriptive Analytics (What happened?): Organizations at this stage use basic reporting and dashboards answering historical questions. “How many customers did we acquire last quarter?” Data exists in silos, analysis is manual, and insights emerge slowly. Approximately 60% of organizations remain at this level.
2. Diagnostic Analytics (Why did it happen?): More sophisticated organizations drill into root causes. “Why did customer acquisition drop in Q3?” This requires data integration, segmentation capabilities, and analytical skills. About 25% of organizations operate here.
3. Predictive Analytics (What will happen?): Advanced statistical modeling and machine learning enable forecasting. “What will customer acquisition be next quarter?” This demands quality data infrastructure, skilled data scientists, and organizational trust in models. Approximately 10% of organizations achieve this maturity.
4. Prescriptive Analytics (What should we do?): Optimization algorithms recommend specific actions. “How should we allocate marketing budget to maximize acquisition?” This requires sophisticated algorithms, integration with operational systems, and willingness to act on recommendations. Only 3-5% of organizations reach this level.
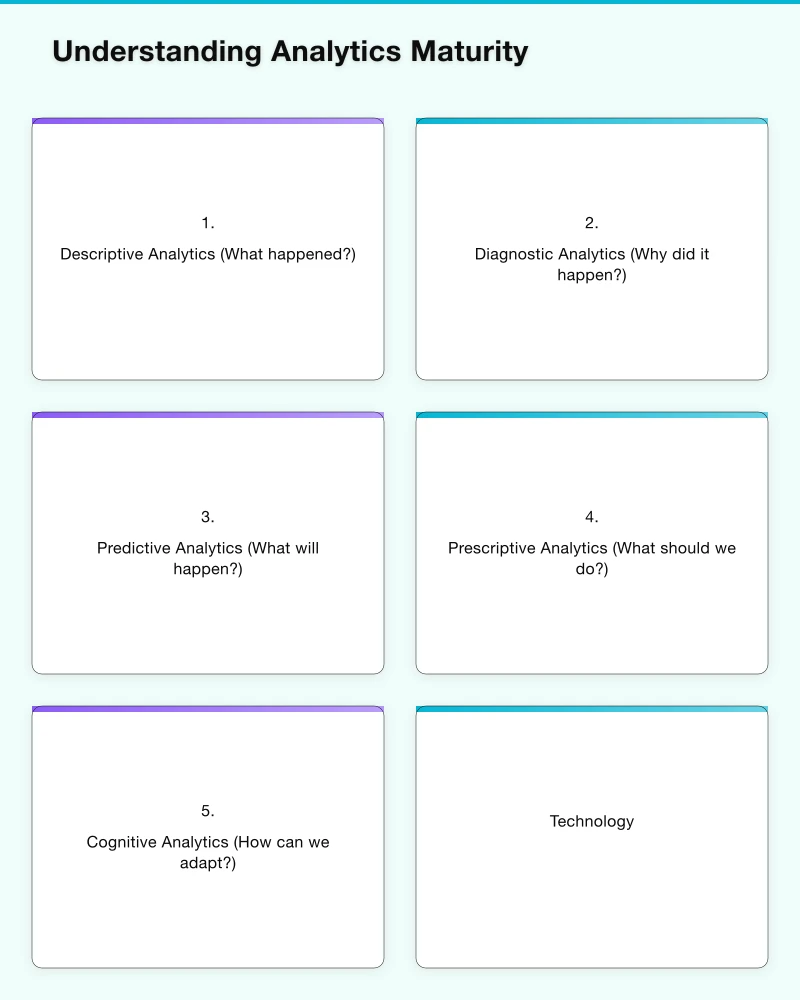
5. Cognitive Analytics (How can we adapt?): AI-powered systems continuously learn and autonomously optimize. “The system automatically reallocates marketing spend as market conditions change.” This bleeding-edge capability requires advanced AI, extensive automation, and organizational comfort with algorithmic decision-making. Less than 2% of organizations operate here.
Critical Assessment Dimensions
Building analytics maturity requires development across four dimensions:
Technology: Data infrastructure, analytics tools, and computational capabilities. Mature organizations invest in cloud data platforms, self-service analytics tools, and automated pipelines. The average organization spends 18% of IT budget on analytics technology.
People: Analytical skills, data literacy, and decision-making culture. Beyond hiring data scientists, mature organizations embed analytical capabilities across functions and cultivate data-driven decision norms. Organizations with high data literacy are 3× more likely to achieve significant business improvements.
Process: How analytics integrates into workflows and decision-making. Mature organizations have formal processes for translating business questions into analytical projects, validating insights, and operationalizing recommendations.
Data: Quality, accessibility, governance, and integration. Poor data quality costs organizations 15-25% of revenue on average. Mature organizations treat data as a strategic asset with formal governance.
Design Thinking Fundamentals
Stanford d.school’s five-phase design thinking process provides structured innovation methodology:
Empathize: Deep user research uncovering needs beyond stated requirements. Ethnographic observation, interviews, and immersion reveal latent needs. Nielsen Norman Group research shows 60-70% of breakthrough innovations come from empathy work rather than stated requests.
Define: Synthesizing research into actionable problem statements. Point-of-view statements frame challenges as “[User] needs [need] because [insight].” This ensures solutions address genuine problems.
Ideate: Generating 50-100+ potential solutions through divergent thinking. Research from Creative Education Foundation demonstrates groups generating 75+ ideas before evaluation produce 3× more innovative solutions.
Prototype: Creating low-fidelity representations enabling fast learning. Paper sketches, wireframes, or cardboard models test concepts cheaply. Testing with 5-8 users uncovers 85% of usability issues.
Test: Validating prototypes with real users, gathering feedback, iterating rapidly. This cycle repeats until solutions effectively address user needs.
Integrating Analytics with Design Thinking
Empathize with Analytics
Traditional empathy work relies on qualitative research—valuable but limited in scale. Integrating analytics enables understanding user needs at scale through behavioral data.
At basic maturity levels (descriptive/diagnostic): Use web analytics, CRM data, and surveys to identify patterns in user behavior. “What features do power users engage with most?” “Why do users abandon checkout?”
At advanced maturity (predictive/prescriptive): Machine learning models segment users by behavioral patterns, predicting needs before users articulate them. Netflix discovered viewing patterns revealing content preferences users themselves didn’t recognize.
Airbnb combines empathy interviews with massive-scale analytics, interviewing 100 hosts while analyzing behavior data from millions. This integration reveals both the “why” (qualitative) and “what/how much” (quantitative) of user needs.
Define with Data-Driven Insights
Problem definition improves dramatically when grounded in analytical evidence. Instead of assuming problems, organizations identify them through systematic analysis.
Descriptive analytics reveals problem symptoms: “Customer satisfaction scores dropped 15 points in Q3.”
Diagnostic analytics uncovers root causes: “Satisfaction dropped specifically among mobile users after the app redesign—analysis shows 40% longer task completion times.”
This evidence-based problem definition focuses innovation efforts on high-impact issues rather than assumed problems. Procter & Gamble’s Connect+Develop program uses analytics to identify specific innovation gaps before engaging design thinking, improving R&D productivity 60%.
Ideate with Predictive Insights
Analytics enhances ideation by revealing opportunity spaces and constraints. Rather than brainstorming in the dark, teams ideate informed by data about what’s possible and likely to succeed.
Predictive models forecast outcomes of different approaches: “If we simplify checkout to three steps, models predict 25% completion rate improvement.”
Benchmarking data grounds creativity in market realities: “Competitors achieve 80% mobile conversion rates—our 45% indicates significant opportunity.”
Spotify’s recommendation algorithm development combines analytical insights about listening patterns with creative ideation about user experience, producing innovations like Discover Weekly that feel magical yet are grounded in data.
Prototype with Measurable Success Criteria
Analytics maturity enables rapid prototype validation through defined metrics. Rather than subjective assessments, teams measure prototype performance against quantitative targets.
Basic analytics: Track simple metrics—click-through rates, task completion times, error rates.
Advanced analytics: A/B testing with statistical significance, multivariate testing, and causal inference methods definitively show which prototypes perform better. Netflix runs 250+ A/B tests simultaneously, validating prototypes with millions of users before full deployment.
This integration dramatically accelerates learning cycles. Amazon’s two-pizza teams prototype features, deploy to small user segments, measure results, and iterate—completing innovation cycles in days rather than months.
Test and Validate Through Comprehensive Analytics
Final validation integrates qualitative user feedback with quantitative performance data. This combination reveals both user satisfaction (qualitative) and business impact (quantitative).
Descriptive analytics confirms adoption: “85% of users engaged with the new feature within first week.”
Diagnostic analytics explains behavior: “Power users average 12 engagements weekly; casual users 2—suggesting two distinct use cases.”
Predictive analytics forecasts long-term impact: “Based on early adoption patterns, models predict 30% increase in monthly active users within six months.”
Uber’s experimentation platform tests every product change using this integrated approach, combining user interviews, behavioral analytics, and long-term outcome modeling before full rollout.
Maturity Alignment Matrix
| Design Thinking Stage | Basic Analytics (Descriptive/Diagnostic) | Advanced Analytics (Predictive/Prescriptive) |
|---|---|---|
| Empathize | Surveys, web analytics, CRM reports | Behavioral clustering, predictive segmentation, sentiment analysis at scale |
| Define | Descriptive reports showing problems | Diagnostic models revealing root causes, impact quantification |
| Ideate | Benchmarking data, historical patterns | Predictive modeling of solution outcomes, optimization algorithms |
| Prototype | Basic metrics (clicks, time on page) | A/B testing, multivariate experiments, causal inference |
| Test | Descriptive adoption metrics | Predictive long-term impact, prescriptive optimization recommendations |
Benefits of Integration
Evidence-Based Creativity: Grounding innovation in data reduces guesswork while maintaining human-centered focus. Capital One’s design thinking + analytics approach increased successful product launches from 40% to 75% over three years.
Faster Validation Cycles: Analytics enables testing hypotheses with real users at scale rather than prolonged research. Google’s 20% time projects combine rapid prototyping with A/B testing, accelerating innovation from idea to launch in weeks.
Reduced Innovation Risk: Data validation identifies failures early when course correction is cheap. Amazon’s “working backwards” process starts with data about customer needs, reducing failed launches 50%.
Scalable Innovation Process: Analytics automation enables parallel testing of multiple innovations. Netflix simultaneously tests dozens of interface variations, learning from 200+ million users continuously.
Implementation Roadmap
Start where you are: Organizations at any maturity level can integrate analytics with design thinking. Basic descriptive analytics combined with empathy work produces better results than either alone.
Build analytical capabilities systematically: Follow maturity models to progressively develop technology, people, process, and data dimensions.
Embed analytics in innovation processes: Make data review mandatory at each design thinking stage—what do we know from data? What gaps remain?
Cultivate integrated skills: Hire or develop “analytics translators” who bridge analytical expertise and design thinking practice.
Conclusion
The retail executive from our introduction solved her paradox by integrating analytics into her design thinking process. Product teams now empathize using behavioral data at scale, define problems based on diagnostic analytics, ideate informed by predictive insights, prototype with clear metrics, and test using comprehensive validation. Innovation success rates doubled within 18 months.
Organizations mastering both analytics maturity and design thinking gain sustainable competitive advantage. Analytics without human-centered design produces sophisticated systems nobody uses. Design thinking without analytics relies on limited qualitative insights and unvalidated assumptions.
Integration creates evidence-based creativity—innovations that are both analytically sound and genuinely meet human needs. This represents the future of business innovation: grounding creativity in data while ensuring technology serves people.
Sources
- Gartner - Data and Analytics Insights - 2024
- McKinsey - Designing Data-Driven Organizations - 2023
- MIT Sloan Management Review - Data-Driven Innovation - 2022
- Interaction Design Foundation - What is Design Thinking - 2024
- Stanford d.school - Design Thinking Resources - 2024
- Harvard Business Review - Building a Data-Driven Organization - 2020
- Nielsen Norman Group - Empathy Mapping - 2024
- Tableau - Business Intelligence Maturity Model - 2024
- Forrester - Insights-Driven Businesses - 2023
- Qlik - Data Literacy - 2024
Learn more about data-driven innovation.
Learn more about data-driven innovation.
Mobile execution is where many digital strategies come to life. Awesome Apps publishes practical guides on app development and mobile UX.
As founder of Ganda Tech Services, I work with Australian businesses to align technology investments with business growth — across cloud, web, and mobile.
About the Author
Ashish Ganda is the founder of Ganda Tech Services, a Sydney-based technology consultancy specialising in cloud infrastructure, web development, and mobile app solutions for Australian businesses.
Digital Transformation Roadmap 2026
A 12-month framework for Australian SMBs ready to modernise — phases, tools, and milestones.