The Power of Data and Analytics in Decision-Making
Introduction
In 2011, Netflix made a decision that shocked the entertainment industry—they would spend $100 million producing House of Cards before shooting a single scene. Traditional studios thought this was reckless. But Netflix knew something others didn’t: their data showed that viewers who liked the British version of House of Cards also watched Kevin Spacey films and David Fincher directed content. Their analytics predicted success with 97% confidence. The show became a hit, validating data-driven decision-making on a massive scale.
Today, data-driven organizations outperform competitors by significant margins. Research from MIT Sloan and Capgemini found that companies in the top quartile for data-driven decision-making are 23 times more likely to acquire customers, 6 times more likely to retain them, and 19 times more likely to be profitable.
Yet according to Gartner’s 2024 Chief Data Officer survey, only 26% of organizations consider themselves truly data-driven. The gap between knowing data matters and actually using it to drive decisions remains wide. This article explores what separates data-driven leaders from those still relying on intuition and tradition.
The Data-Driven Organization
Cultural Transformation Required
Becoming data-driven isn’t about buying analytics software—it’s about changing how decisions get made. McKinsey research on data-driven transformation found that culture accounts for 70% of success or failure in analytics initiatives.
What does data culture look like in practice?
Questions replace assumptions: Instead of “I think customers prefer this feature,” teams ask “What does usage data show about feature preferences?” At Amazon, every product meeting starts with reviewing metrics, not opinions. Jeff Bezos famously requires all proposals to include data supporting recommendations.
Experimentation becomes standard: Data-driven companies test hypotheses rather than debating them. Microsoft runs over 10,000 A/B tests annually, systematically testing product changes before full rollout. According to their research team, about 80% of tested ideas fail—but the 20% that succeed drive significant value because they’re validated by data, not hunches.
Failure gets quantified and learned from: When decisions go wrong, data-driven organizations analyze why. Google’s Project Oxygen analyzed hundreds of management decisions to identify what actually makes effective leaders—data that contradicted many long-held beliefs about management.
Infrastructure for Analytics
Data culture needs supporting infrastructure. According to IDC’s worldwide data and analytics spending guide, organizations invested $230 billion globally in analytics technologies in 2024—up 11% from 2023.
Essential components include:
Modern data architecture: Cloud data warehouses like Snowflake, Google BigQuery, and AWS Redshift centralize data from multiple sources. Snowflake’s case study library documents companies analyzing petabytes of data—volumes impossible with traditional databases.
Self-service analytics tools: Platforms like Tableau, Power BI, and Looker let business users explore data without SQL knowledge. Forrester research found organizations using self-service analytics make decisions 5x faster than those dependent on IT for every report.
Data governance frameworks: Research from Stanford shows organizations with clear data governance—defining data ownership, quality standards, and access controls—achieve 40% higher data quality scores and 35% faster time to insights.
Integration into Workflows
Analytics must fit into how people actually work. Forrester’s analysis of analytics adoption found that 73% of data goes unused because insights don’t reach decision-makers at the right time.
Successful integration looks like:
Embedded analytics: Salesforce builds analytics directly into CRM workflows, surfacing predictions about deal closure probability right where sales reps work. According to Salesforce’s State of Sales report, teams using embedded analytics close 28% more deals.
Automated alerting: Rather than waiting for monthly reports, systems notify stakeholders when metrics hit thresholds. Retailers use this for inventory management—alerts trigger when stock levels suggest upcoming shortages based on historical patterns.
Decision support systems: Airlines use dynamic pricing algorithms making millions of pricing decisions daily based on demand forecasts, competitor prices, and booking patterns. American Airlines reports their revenue management system increased revenues by $500 million annually.
The Four Types of Analytics
Descriptive Analytics: Understanding What Happened
Descriptive analytics examines historical data to understand past performance. Dashboards, reports, and business intelligence tools fall into this category.
Example: Walmart’s sales dashboards show exactly which products sold, where, and when. According to case studies of Walmart’s analytics, their system processes 2.5 petabytes of data hourly—equivalent to 167 times the books in the US Library of Congress.
Diagnostic Analytics: Discovering Why It Happened
Diagnostic analytics digs deeper to understand root causes. Why did sales drop last quarter? Why did customer churn increase?
Spotify’s diagnostic analytics revealed that users who created their first playlist within 24 hours of signing up were 3x more likely to remain subscribers after one month. This insight shifted their onboarding strategy to emphasize playlist creation immediately.
Predictive Analytics: Forecasting What Will Happen
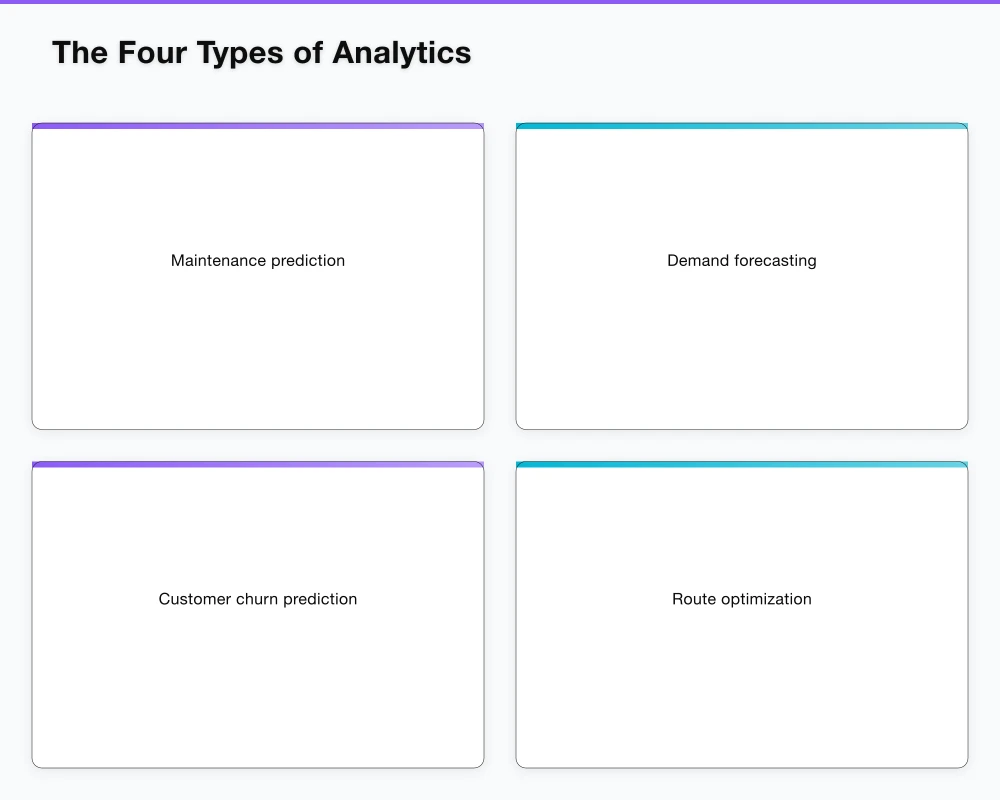
Predictive analytics uses statistical models and machine learning to forecast future outcomes. According to Forrester’s predictive analytics research, 57% of enterprises now use predictive models in at least one business function.
Maintenance prediction: GE’s Predix platform analyzes sensor data from jet engines, predicting failures weeks in advance. Airlines using predictive maintenance reduce unplanned downtime by 30-50%, according to GE’s data.
Demand forecasting: Amazon’s supply chain uses machine learning to predict demand for millions of products across thousands of locations. Their research papers show 15-20% improvement in forecast accuracy compared to traditional methods, directly reducing excess inventory costs.
Customer churn prediction: Telecom companies model which customers will likely cancel service. Research from Bain & Company shows that reducing churn by just 5% increases profits by 25-95%, making accurate prediction extremely valuable.
Prescriptive Analytics: Recommending What to Do
Prescriptive analytics goes beyond prediction to recommend specific actions. These systems use optimization algorithms and simulation to identify the best course of action.
Route optimization: UPS’s ORION (On-Road Integrated Optimization and Navigation) system analyzes 250 million address points daily to optimize delivery routes. UPS reports ORION saves 10 million gallons of fuel annually—a $400 million cost reduction.
Dynamic pricing: Airlines, hotels, and ride-sharing services use prescriptive analytics to set prices in real-time. Uber’s surge pricing algorithm balances driver supply and rider demand by adjusting prices dynamically, increasing driver availability during peak times by 25-40%.
Treatment optimization: Healthcare providers use prescriptive analytics to recommend optimal treatment plans based on patient characteristics and treatment outcome data. Johns Hopkins research shows AI-driven treatment recommendations improve patient outcomes by 12-18% for complex conditions.
Measurable Benefits
Financial Performance Impact
The financial case for data-driven decision-making is compelling. Deloitte’s analytics advantage research tracked financial performance of organizations rated on analytics maturity:
- Revenue growth: Top-quartile firms grew revenue 15.2% annually vs. 5.4% for bottom-quartile
- Operating margin: Data-driven companies averaged 22% margins vs. 14% for intuition-driven peers
- Market valuation: Analytics leaders traded at 12.4x EBITDA multiples vs. 8.2x for laggards
Operational Efficiency
Analytics drives measurable efficiency improvements. McKinsey’s analysis across industries shows:
- Manufacturing: Predictive maintenance reduces downtime by 30-50% and maintenance costs by 20-40%
- Retail: Demand forecasting improves inventory turns by 25-35%, freeing up working capital
- Logistics: Route optimization reduces fuel costs by 15-25% and improves on-time delivery by 20-30%
Risk Reduction
Data analytics helps organizations avoid costly mistakes. PwC’s risk analytics research found:
- Credit risk: Banks using advanced analytics reduce default rates by 25-35% through better risk assessment
- Fraud detection: Machine learning fraud detection systems catch 40-60% more fraud than rule-based systems
- Compliance: Automated compliance monitoring reduces regulatory violations by 50-70%
Implementation Challenges
Data Quality Issues
Poor data quality undermines analytics. Gartner research estimates poor data quality costs organizations an average of $12.9 million annually.
Common issues include:
- Incomplete records (missing critical fields)
- Inconsistent data formats across systems
- Duplicate entries
- Outdated information
- Inaccurate data entry
Solution approaches: Organizations tackle data quality through data governance teams, automated data quality checks, master data management systems, and regular data audits. IBM’s data quality framework provides methodologies organizations use to improve accuracy from typical 60-70% to target 95%+ levels.
Cultural Resistance
People resist changing how they make decisions. Harvard Business Review research found 70% of change initiatives fail, with cultural resistance as the primary cause.
Resistance manifests as:
- “I’ve always done it this way and it works”
- “Data can’t capture everything important”
- “This is too complex for our people”
- Fear that analytics will reveal poor past decisions or make roles obsolete
Solution approaches: Change management research from Prosci shows success factors include executive sponsorship (visible leaders championing analytics), early wins (quick projects demonstrating value), and training (building data literacy across the organization).
Skills Gap
LinkedIn’s 2024 Jobs Report lists data science and analytics as the #2 skills gap globally, with demand growing 28% annually but talent supply growing only 14%.
Organizations address this through:
- Training existing staff: Online platforms like Coursera and DataCamp enable upskilling
- Hiring specialists: Building analytics centers of excellence with data scientists, analysts, and engineers
- Low-code tools: Platforms enabling analysis without programming (Tableau, Power BI, Alteryx)
- External partners: Consulting firms and analytics service providers supplementing internal capabilities
Keys to Success
According to NewVantage Partners’ annual executive survey, which tracks Fortune 1000 data initiatives:
Executive Sponsorship: 92.2% of successful initiatives had active C-suite sponsorship vs. 23% of failed projects. CEOs and CFOs must visibly prioritize data-driven decisions.
Clear Business Objectives: Analytics projects tied to specific business goals (reduce churn 10%, improve forecast accuracy 20%) succeed 3x more often than exploratory “let’s see what we find” projects.
Data Governance: Organizations with established data governance achieve insights 35% faster and have 40% higher user trust in data accuracy.
Iterative Approach: Starting small with pilots, proving value, then scaling works better than massive “transform everything” initiatives. Agile analytics methods deliver working insights in weeks rather than waiting months for perfect systems.
Conclusion
Data and analytics have moved from competitive advantage to competitive necessity. Organizations that can turn data into insights, and insights into actions faster than competitors will win in their markets.
The Netflix story from our introduction illustrates this perfectly. While traditional studios debated creative intuition vs. financial risk, Netflix let data guide a $100 million bet—and won. Today they use analytics to decide which shows to produce, how to market them, when to release episodes, and even how to design thumbnails. Their data-driven approach helped build a $150 billion company.
The question isn’t whether your organization should become more data-driven. The question is how quickly you can make the transformation before competitors using data better than you take your customers, your market share, and your future.
Sources
- MIT Sloan & Capgemini - Digital Maturity Research - 2024
- Gartner - Chief Data Officer Survey - 2024
- McKinsey - Building Data-Driven Companies - 2024
- Amazon - 2016 Letter to Shareholders - 2016
- Microsoft Research - Experimentation Platform - 2024
- Google Re:Work - Project Oxygen - 2023
- IDC - Worldwide Data and Analytics Spending - 2024
- Forrester - Enterprise Insight Platforms Wave - 2024
- Salesforce - State of Sales Report - 2024
- Harvard Business Review - Walmart Data Strategy - 2012
- Forrester - Predictive Analytics Research - 2024
- Bain & Company - Customer Retention Economics - 2023
- Deloitte - Insight-Driven Organizations - 2024
- McKinsey - Analytics in Operations - 2024
- Gartner - Data Quality Impact - 2024
- Harvard Business Review - Change Management - 2020
- LinkedIn - Jobs Report 2024 - 2024
Learn more about building data-driven organizations.
Learn more about building data-driven organizations.
A digital strategy without mobile is incomplete. Awesome Apps publishes practical guides on building apps that Australian users love.
Ash Ganda is the founder of Ganda Tech Services, a Sydney-based technology consultancy delivering cloud, web, and mobile solutions for Australian businesses.
About the Author
Ashish Ganda is the founder of Ganda Tech Services, a Sydney-based technology consultancy specialising in cloud infrastructure, web development, and mobile app solutions for Australian businesses.
Digital Transformation Roadmap 2026
A 12-month framework for Australian SMBs ready to modernise — phases, tools, and milestones.