SRE Practices for Enterprise: Building Reliability Engineering at Scale
Site Reliability Engineering has evolved from Google’s internal practice into an industry-standard approach for managing complex systems at scale. Yet enterprise adoption often struggles to translate SRE principles into operational reality. Organizations hire SRE titles without changing practices, implement SLOs without error budget governance, and conduct postmortems without driving systemic improvement. For CTOs building reliable enterprise systems, the challenge is implementing SRE authentically rather than superficially.
The stakes have increased substantially. Digital services now underpin core business operations, making reliability a competitive differentiator rather than a technical concern. Gartner research indicates that the average cost of IT downtime exceeds $5,600 per minute for enterprise organizations, with customer-facing service disruptions causing reputational damage that compounds financial impact. Organizations that master SRE practices achieve reliability that enables business growth while those struggling with operational chaos constrain their own potential.
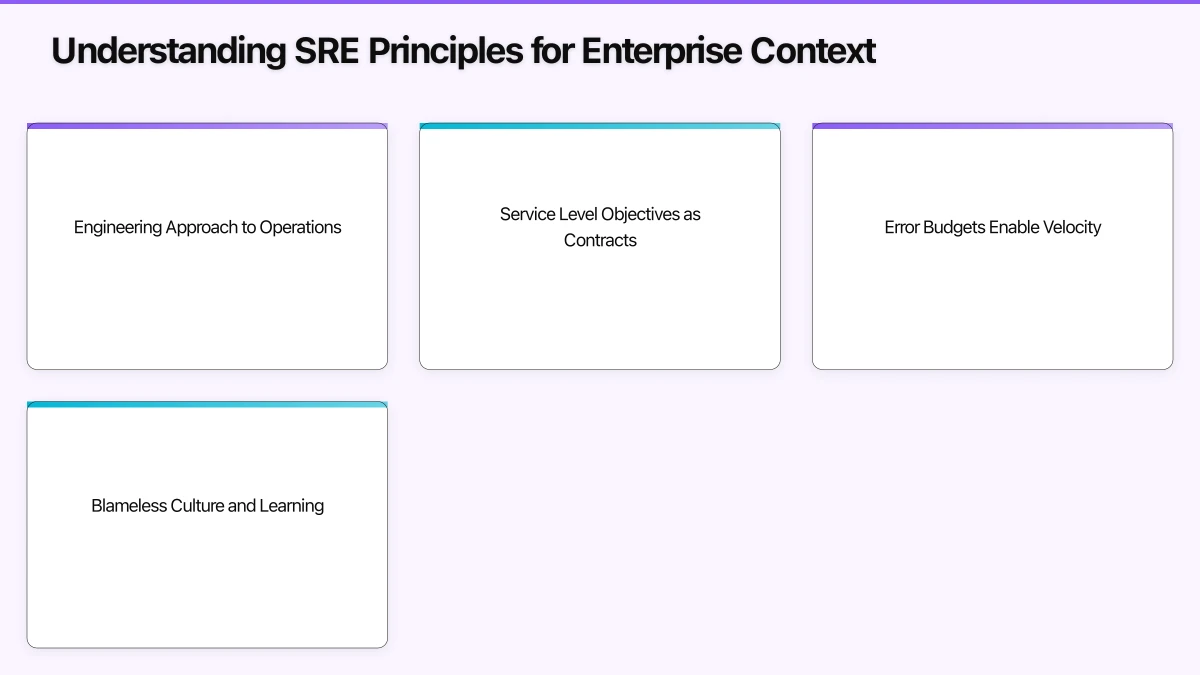
Understanding SRE Principles for Enterprise Context
SRE provides a principled approach to reliability that balances system stability with development velocity. Understanding these principles enables authentic implementation rather than cargo cult adoption.
Engineering Approach to Operations: SRE treats operations as a software engineering problem. Toil is automated, systems are designed for reliability, and operational work follows engineering discipline. This contrasts with traditional operations focused on manual intervention and reactive firefighting.
For enterprises, this means shifting operational investment from staff executing manual procedures to engineers building reliable systems. The goal is reducing the marginal cost of operations as systems scale, enabling growth without proportional operational headcount increases.
Service Level Objectives as Contracts: SLOs define reliability targets that balance user needs with engineering investment. Rather than pursuing maximum reliability, SRE organizations determine appropriate reliability levels and engineer to achieve them efficiently.
Enterprise SLOs must reflect business context. A payment processing system requires different reliability characteristics than an internal reporting tool. SLOs should derive from user expectations and business impact, not arbitrary technical targets.
Error Budgets Enable Velocity: Error budgets quantify acceptable unreliability. If a service has 99.9% availability SLO, the error budget is 0.1% (approximately 43 minutes monthly). Teams can “spend” this budget on deployments and changes that might cause incidents.
Error budgets resolve the inherent tension between reliability and feature velocity. When budgets are healthy, teams can move fast; when exhausted, focus shifts to reliability improvements. This creates objective criteria for balancing competing priorities.
Blameless Culture and Learning: SRE cultures treat incidents as learning opportunities rather than occasions for punishment. Blameless postmortems examine systemic factors contributing to incidents, driving improvements that prevent recurrence.
Enterprise adoption requires cultural shift from blame-oriented incident response. Leaders must model blameless behavior, protecting teams from punitive responses while maintaining accountability for improvement.
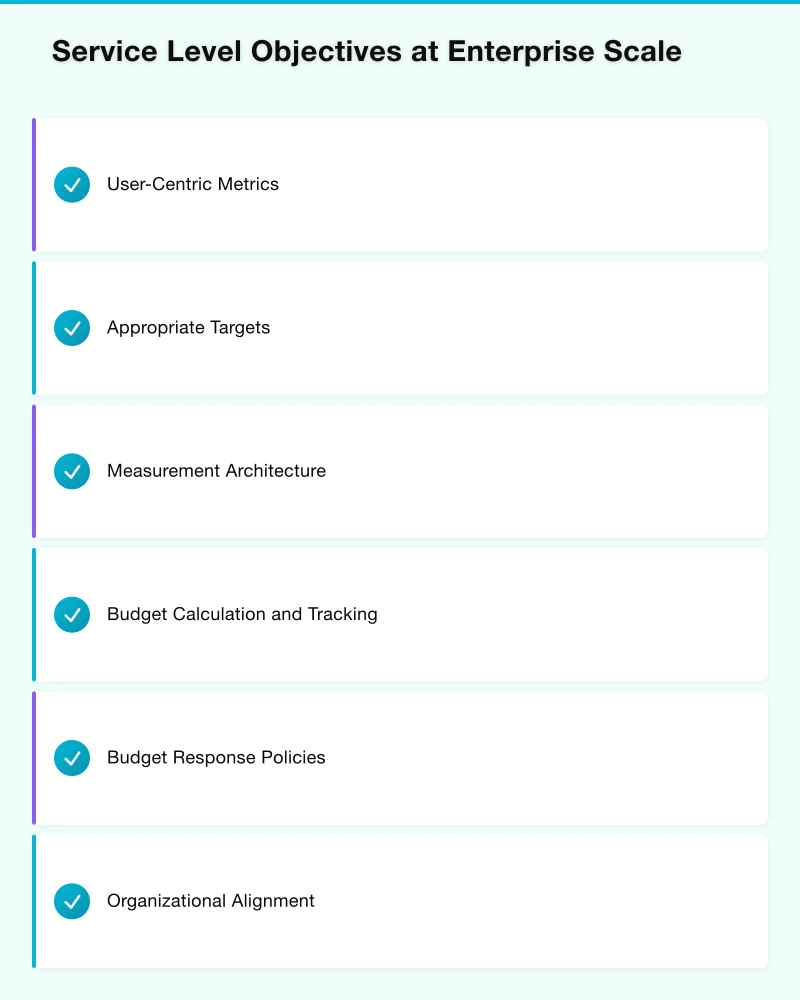
Service Level Objectives at Enterprise Scale
SLO implementation determines whether organizations gain SRE benefits or merely add complexity without value.
SLO Design Principles
User-Centric Metrics: SLOs should measure what users experience, not what systems do internally. Availability from the user perspective matters; server uptime is a supporting metric. Latency experienced by users matters; database query time is an implementation detail.
Common SLO categories include:
Availability: The proportion of requests that succeed. Measured at service boundaries from the user perspective.
Latency: The time to respond to requests. Typically specified at percentiles (p50, p95, p99) to capture distribution characteristics.
Throughput: The volume of work completed. Relevant for batch systems and data pipelines.
Quality: The correctness of responses. Relevant for systems where incorrect responses cause harm even if delivered successfully.
Appropriate Targets: SLOs should be achievable and meaningful. Targets set too high create impossible standards that teams abandon; targets set too low provide no meaningful reliability guarantee.
Consider the reliability hierarchy:
- 99% (43 hours monthly downtime): Suitable for internal tools and non-critical services
- 99.9% (43 minutes monthly downtime): Standard for business-critical services
- 99.99% (4 minutes monthly downtime): High-reliability requirements; significant engineering investment
- 99.999% (26 seconds monthly downtime): Exceptional reliability; requires redundancy across failure domains
Most enterprise services should target 99.9-99.95% availability. Higher targets require exponentially increasing investment.
Measurement Architecture: SLOs require reliable measurement infrastructure. Measurement systems must be more reliable than the services they measure; unreliable measurement creates confusion about actual service health.
Implement measurement at service boundaries, capturing actual user experience. Synthetic monitoring supplements real user monitoring for services with variable traffic. Multiple measurement perspectives identify measurement failures versus service failures.
Error Budget Governance
Error budgets only create value when governance processes respond to budget status.
Budget Calculation and Tracking:
Error budget = 100% - SLO target
For a 99.9% SLO:
- Monthly budget: 43 minutes (0.1% of ~43,200 minutes)
- Quarterly budget: 130 minutes
- Annual budget: 526 minutes
Track consumption continuously, with dashboards showing remaining budget and consumption rate.
Budget Response Policies:
Define responses to budget status:
Budget Healthy (>50% remaining): Normal operations. Feature velocity prioritized. Changes proceed with standard review.
Budget Concerned (25-50% remaining): Increased scrutiny. Major changes require additional review. Reliability improvements prioritized.
Budget Critical (under 25% remaining): Feature freeze for non-critical changes. All engineering focus on reliability. Incident prevention measures activated.
Budget Exhausted: Emergency measures. All changes halted except reliability improvements. Post-exhaustion review required.
Organizational Alignment:
Error budget policies require organizational support. Product management must accept feature freezes when budgets exhaust. Engineering leadership must support reliability investment. Executive sponsors must resist pressure to override governance.
Without organizational alignment, error budgets become meaningless metrics that teams ignore under delivery pressure.
SLO Hierarchy and Dependencies
Enterprise systems involve complex service dependencies. SLO design must account for these relationships.
Dependency SLO Budgeting: A service cannot be more reliable than its dependencies. If Service A depends on Service B, and Service B has 99.9% SLO, Service A cannot reliably achieve higher than 99.9% availability.
Design SLO hierarchies that account for dependencies:
- Critical dependencies should have SLOs higher than dependent services
- Graceful degradation reduces dependency SLO impact
- Redundancy across dependencies enables higher composite reliability
Platform SLOs: Shared platforms (databases, message queues, identity services) require SLOs that support all dependent services. Platform SLOs should exceed the most stringent consumer requirement with margin for error.
External Dependency Management: Third-party services and cloud provider components introduce SLO constraints outside organizational control. Document external dependency SLOs and architect for their failure. Build SLO buffers accounting for external reliability.
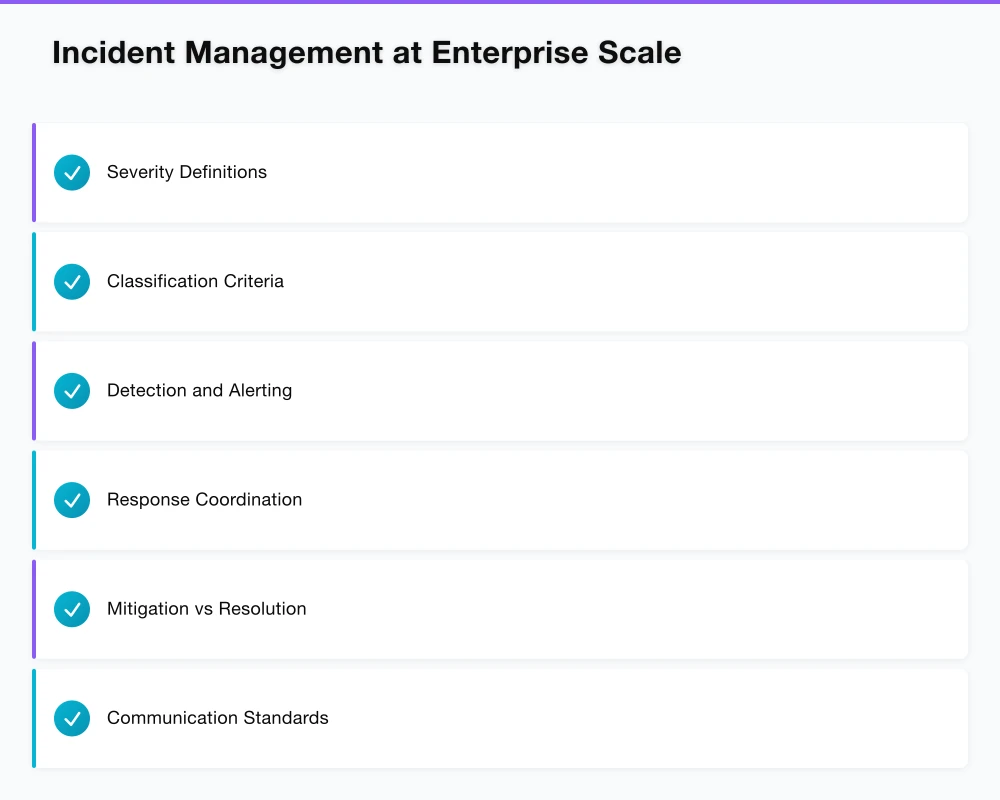
Incident Management at Enterprise Scale
Incident management processes translate SRE principles into operational response.
Incident Classification
Severity Definitions:
Consistent severity classification enables appropriate response:
SEV1 - Critical: Complete service failure or security incident. Immediate customer impact. Executive notification required.
SEV2 - Major: Significant degradation affecting substantial users. Elevated response with on-call escalation.
SEV3 - Minor: Partial degradation with limited user impact. Standard on-call response.
SEV4 - Low: Minimal impact, often internal or cosmetic issues. Handled during business hours.
Classification Criteria:
Define objective criteria for severity determination:
- User impact (percentage affected, impact severity)
- Business impact (revenue, reputation, compliance)
- Duration expectations
- Escalation requirements
Avoid severity inflation that creates alert fatigue or severity deflation that delays response.
Incident Response Process
Detection and Alerting:
Effective detection requires comprehensive monitoring across all service dimensions, alert rules tuned to minimize false positives while catching real incidents, multiple notification channels ensuring responders receive alerts, and escalation paths for unacknowledged alerts.
Response Coordination:
Structured response improves incident outcomes:
Incident Commander: Coordinates response, manages communication, makes decisions. Does not perform technical work.
Technical Lead: Directs technical investigation and remediation. Coordinates technical responders.
Communications Lead: Manages stakeholder communication. Updates status pages, notifies affected parties.
Clear role assignment prevents confusion and ensures all response functions are covered.
Mitigation vs Resolution:
Prioritize mitigation over root cause resolution during incidents. Restore service first; investigate causes after stability. Rolling back changes, enabling circuit breakers, or shifting traffic often restores service faster than debugging root causes.
Communication Standards:
Define communication expectations:
- Internal updates every 15-30 minutes during active incidents
- Customer communication within defined SLA based on severity
- Executive notification for SEV1/SEV2 incidents
- Status page updates reflecting current state
Postmortem Practice
Postmortems drive systemic improvement from incidents.
Blameless Investigation:
Focus investigation on systemic factors:
- What conditions enabled the incident?
- What detection gaps delayed response?
- What process failures complicated resolution?
- What system improvements would prevent recurrence?
Avoid individual blame. When human error contributes, examine why systems allowed error to cause incidents rather than punishing individuals.
Timeline Construction:
Build detailed timelines:
- What happened and when
- Who took what actions
- What information was available
- What decisions were made
Timelines reveal gaps in detection, response delays, and coordination failures.
Action Item Rigor:
Postmortems must produce actionable improvements:
- Specific, measurable action items
- Clear ownership assignment
- Realistic deadlines
- Tracking to completion
Organizations that generate action items without completing them erode postmortem credibility.
Knowledge Distribution:
Share postmortem learnings:
- Published postmortems accessible organization-wide
- Regular postmortem reviews highlighting patterns
- Training incorporating incident learnings
- Cross-team sharing for similar systems
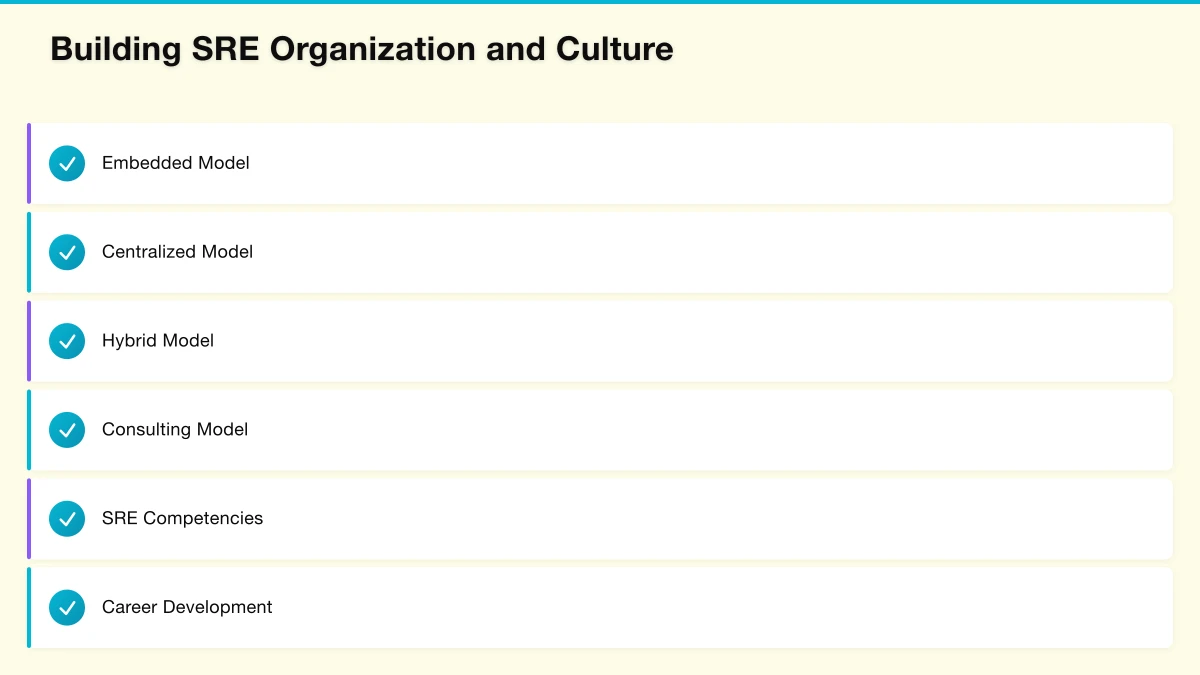
Building SRE Organization and Culture
SRE success depends on organizational structure and culture as much as technical practices.
Organizational Models
Embedded Model: SREs embedded within product teams. Provides deep product knowledge and tight collaboration but risks isolation and inconsistent practices across teams.
Centralized Model: SRE team serving multiple products. Enables consistent practices and shared expertise but may lack product context and create handoff friction.
Hybrid Model: Central SRE platform team with embedded SREs in critical product teams. Balances consistency with product knowledge. Most common enterprise approach.
Consulting Model: SRE expertise provided on-demand to teams. Scales expertise across organization but limits sustained engagement.
Select models based on organizational context. Larger organizations often use hybrid approaches; smaller organizations may embed or centralize based on team structure.
Skill Development
SRE Competencies:
Effective SREs combine multiple skill sets:
- Systems engineering (Linux, networking, distributed systems)
- Software development (scripting, tooling, automation)
- Operations knowledge (monitoring, incident response, capacity planning)
- Problem-solving (debugging, root cause analysis)
- Communication (documentation, stakeholder management)
Recruiting challenges often stem from seeking all competencies in single candidates. Build teams with complementary skills rather than seeking unicorns.
Career Development:
SRE career paths should include:
- Technical track advancing through senior and principal levels
- Management track for those preferring people leadership
- Architecture track for system design expertise
Clear progression retains talent and provides development motivation.
Cultural Elements
Production Ownership: Teams owning production for their services develop reliability mindsets. “You build it, you run it” creates incentives for building reliable systems.
Toil Reduction: Measure and reduce toil (repetitive, manual, automatable work). Set targets for toil percentage (Google’s guidance: under 50% of SRE time). Automate high-toil activities.
Psychological Safety: Teams must feel safe reporting issues, acknowledging mistakes, and raising concerns. Fear-driven cultures hide problems until they become crises.
Learning Orientation: Treat failures as learning opportunities. Celebrate near-misses that reveal weaknesses. Share failures openly to distribute learnings.
Implementing SRE in Enterprise Organizations
Phased implementation enables organizational learning and value demonstration.
Phase 1: Foundation (Months 1-4)
Establish Observability:
- Deploy comprehensive monitoring across critical services
- Implement centralized logging with search capability
- Enable distributed tracing for request flows
- Create initial dashboards for service health visibility
Define Initial SLOs:
- Select 3-5 critical services for initial SLO implementation
- Define availability and latency SLOs based on user expectations
- Implement measurement infrastructure
- Begin tracking SLO compliance
Incident Process:
- Document incident classification criteria
- Establish on-call rotations for critical services
- Implement incident communication templates
- Begin conducting postmortems
Phase 2: Maturation (Months 4-8)
Error Budget Governance:
- Implement error budget tracking dashboards
- Define budget response policies
- Gain organizational alignment on budget governance
- Begin enforcing budget-based decisions
Expand SLO Coverage:
- Extend SLOs to additional services
- Refine SLO targets based on operational experience
- Implement SLO-based alerting
- Create SLO documentation and review cadences
Postmortem Program:
- Establish regular postmortem review sessions
- Implement action item tracking
- Begin pattern analysis across incidents
- Share learnings organization-wide
Phase 3: Optimization (Months 8-12)
Advanced Practices:
- Chaos engineering programs testing resilience
- Capacity planning integration with SLOs
- Automated remediation for common issues
- Cross-team reliability programs
Organizational Development:
- SRE career paths and progression
- Training programs for reliability skills
- Community of practice for knowledge sharing
- Executive reporting on reliability metrics
Continuous Improvement:
- Regular SLO review and refinement
- Process improvement based on operational experience
- Tool optimization based on usage patterns
- Cultural assessment and development
Measuring SRE Program Effectiveness
Metrics demonstrate value and identify improvement opportunities.
Reliability Metrics:
- SLO compliance rates by service
- Error budget consumption trends
- Incident frequency by severity
- Mean time to detection (MTTD)
- Mean time to resolution (MTTR)
Operational Efficiency:
- Toil percentage by team
- Automation coverage
- On-call burden distribution
- Postmortem completion rates
- Action item completion rates
Business Impact:
- Downtime costs (avoided through reliability)
- Customer satisfaction correlation with reliability
- Developer velocity enabled by reliable platforms
- Incident response cost trends
Regular reporting to stakeholders ensures continued investment and enables program optimization.
Common Challenges and Solutions
Enterprise SRE adoption encounters predictable challenges.
SLO Adoption Resistance: Teams resist SLO accountability.
Solution: Start with services where teams are willing. Demonstrate value before expanding. Ensure SLOs are achievable and meaningful.
Error Budget Overrides: Pressure to ignore exhausted budgets.
Solution: Executive sponsorship for governance. Document override decisions and outcomes. Build case for governance through override failures.
Postmortem Fatigue: Teams conduct postmortems without driving improvement.
Solution: Reduce postmortem scope to significant incidents. Track action item completion rigorously. Celebrate improvements driven by postmortems.
Tool Proliferation: Multiple observability tools creating fragmented visibility.
Solution: Consolidate on integrated platforms. Define tool standards and governance. Migrate legacy tools systematically.
Cultural Resistance: Blame culture persists despite policy changes.
Solution: Leadership modeling blameless behavior. Protecting teams from punitive responses. Sustained communication and reinforcement.
Looking Forward: SRE Evolution
SRE practices continue evolving with technology and organizational contexts.
AIOps Integration: Machine learning increasingly assists incident detection and response. Anomaly detection, correlation, and suggested remediation augment human operators.
Platform Engineering Convergence: SRE and platform engineering disciplines are converging. Internal developer platforms incorporate reliability as first-class concern.
Sustainability Focus: Environmental sustainability adds to reliability considerations. Efficiency improvements reduce both cost and carbon footprint.
Distributed Architecture Complexity: Microservices, serverless, and edge computing increase system complexity. SRE practices must evolve for these architectures.
Organizations with strong SRE foundations position themselves to adopt emerging practices efficiently.
Sources
- Beyer, B., Jones, C., Petoff, J., & Murphy, N. R. (2016). Site Reliability Engineering: How Google Runs Production Systems. O’Reilly Media.
- Beyer, B., Murphy, N. R., Rensin, D. K., Kawahara, K., & Thorne, S. (2018). The Site Reliability Workbook: Practical Ways to Implement SRE. O’Reilly Media.
- Gartner. (2024). The Cost of Downtime. Gartner Research.
- Google Cloud. (2024). SRE Principles and Practices. https://sre.google/
- DORA. (2024). Accelerate State of DevOps Report. Google Cloud.
Ash Ganda is a technology executive specializing in enterprise reliability and platform engineering. Connect on LinkedIn to discuss SRE implementation for your organization.
For practical web design and SEO guidance, my team at Cosmos Web Tech helps Australian businesses build high-performing websites.
I lead Ganda Tech Services, where we turn digital strategy into results through specialist cloud, web design, and mobile app teams across Sydney.
About the Author
Ashish Ganda is the founder of Ganda Tech Services, a Sydney-based technology consultancy specialising in cloud infrastructure, web development, and mobile app solutions for Australian businesses.
Digital Transformation Roadmap 2026
A 12-month framework for Australian SMBs ready to modernise — phases, tools, and milestones.