FinOps Cloud Cost Management: Executive Guide for CTOs
As enterprise cloud spending approaches $679 billion globally in 2024, CTOs face an uncomfortable reality: the operational model that delivered rapid cloud adoption is now the primary driver of cost inefficiency. Organizations are discovering that “lift and shift” migrations, decentralized provisioning, and reactive cost management create technical debt that compounds monthly.
The strategic response isn’t cost reduction—it’s FinOps. The FinOps Foundation framework represents a fundamental shift in cloud economics: from technology expense to managed investment portfolio. For CTOs navigating board-level scrutiny of cloud ROI, implementing FinOps is no longer optional—it’s a competitive requirement.
This guide provides the executive framework for building enterprise FinOps capabilities, from cultural transformation to tooling strategy and measurable outcomes.
Understanding the FinOps Framework
FinOps—Financial Operations for cloud—emerged from the recognition that traditional IT financial management models break down in variable-cost cloud environments. Unlike capital expenditure cycles with annual budgets, cloud economics require real-time visibility, continuous optimization, and cross-functional accountability.
The FinOps Foundation defines three core principles that distinguish mature cloud financial management:
Teams need to collaborate. Cloud cost optimization cannot be delegated to finance teams or centralized IT. Engineering teams make architectural decisions that drive 70-80% of cloud costs through service selection, data transfer patterns, and compute configurations. Finance teams control budgets and forecasting models. Executive leadership sets strategic priorities that determine acceptable cost-performance tradeoffs. FinOps creates the framework where these groups operate from shared data and aligned incentives.
Everyone takes ownership for their cloud usage. Decentralized decision-making—the operating model that enables developer velocity—requires decentralized accountability. FinOps implements this through cost allocation tagging, team-level budgets, and transparent showback or chargeback models. When engineering teams see the P&L impact of architectural choices in real-time, optimization becomes intrinsic to delivery workflows rather than a periodic finance exercise.
A centralized team drives FinOps. While ownership distributes across the organization, execution requires specialized capabilities. A central FinOps team establishes governance frameworks, manages tooling platforms, develops cost modeling capabilities, and provides consultative support to engineering and product teams. This team reports to the CFO or CTO depending on organizational maturity, with representation from finance, engineering, and operations.
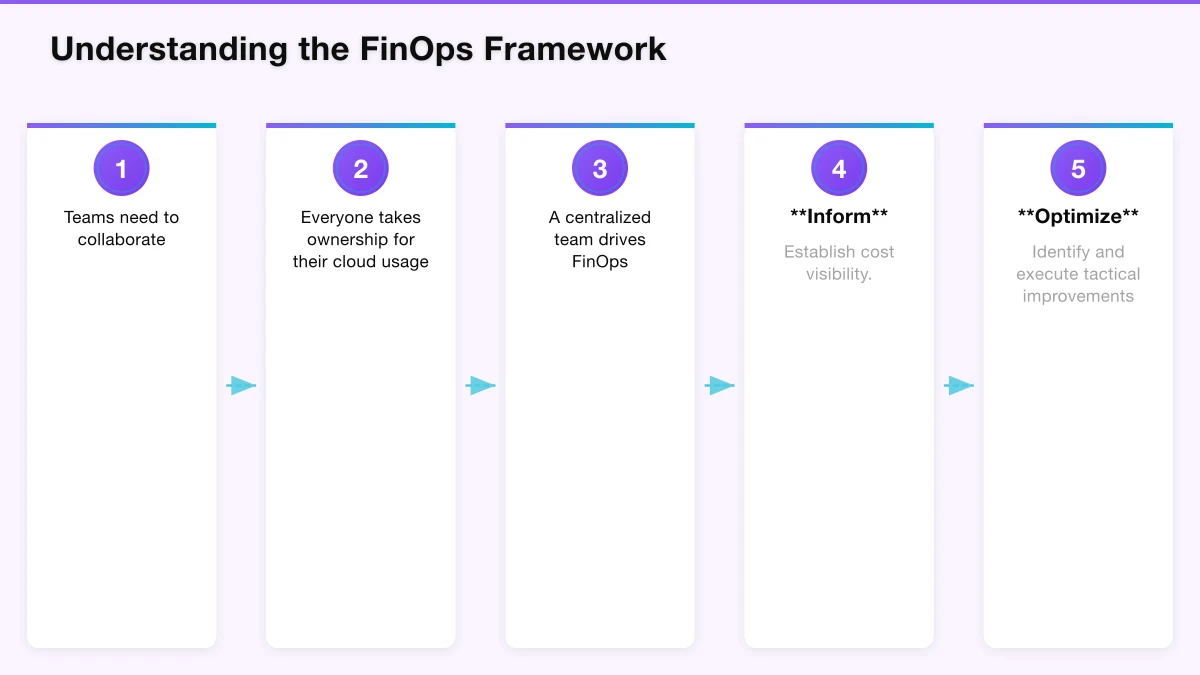
These principles translate into a six-phase maturity model that most enterprises navigate over 18-36 months:
- Inform: Establish cost visibility and allocation accuracy
- Optimize: Identify and execute tactical improvements
- Operate: Build continuous optimization into delivery workflows
- Collaborate: Align cross-functional teams on cost objectives
- Forecast: Develop predictive cost modeling capabilities
- Govern: Implement policy-driven cost controls
The strategic insight for CTOs: FinOps maturity correlates directly with cloud operational maturity. Organizations achieving “Operate” phase capabilities report 30-40% lower unit costs compared to peers in “Inform” phase, primarily through architectural efficiency rather than discount negotiation.
Building FinOps Culture and Team Structure
The most common FinOps implementation failure isn’t technical—it’s organizational. CTOs launching FinOps initiatives without addressing cultural and structural prerequisites face predictable obstacles: engineering resistance to cost accountability, finance teams overwhelmed by cloud complexity, and executive leadership questioning ROI after six months without measurable impact.
Successful FinOps transformation starts with team structure that reflects organizational scale:
For organizations spending $5-20M annually: A virtual team model typically suffices. A senior finance analyst (0.5-1.0 FTE) partners with a cloud architect (0.5 FTE) to establish basic cost allocation, implement initial tooling, and build reporting frameworks. This team operates within existing finance and engineering organizations, meeting weekly to review trends and quarterly to establish optimization priorities.
For organizations spending $20-100M annually: A dedicated FinOps team becomes essential. The typical structure includes a FinOps lead (finance or engineering background), 1-2 FinOps engineers with cloud platform expertise, and a finance analyst. This team owns the FinOps tooling platform, conducts monthly business reviews with engineering leadership, and maintains the cost allocation model. At this scale, organizations typically implement chargeback models that create P&L accountability at the product or BU level.
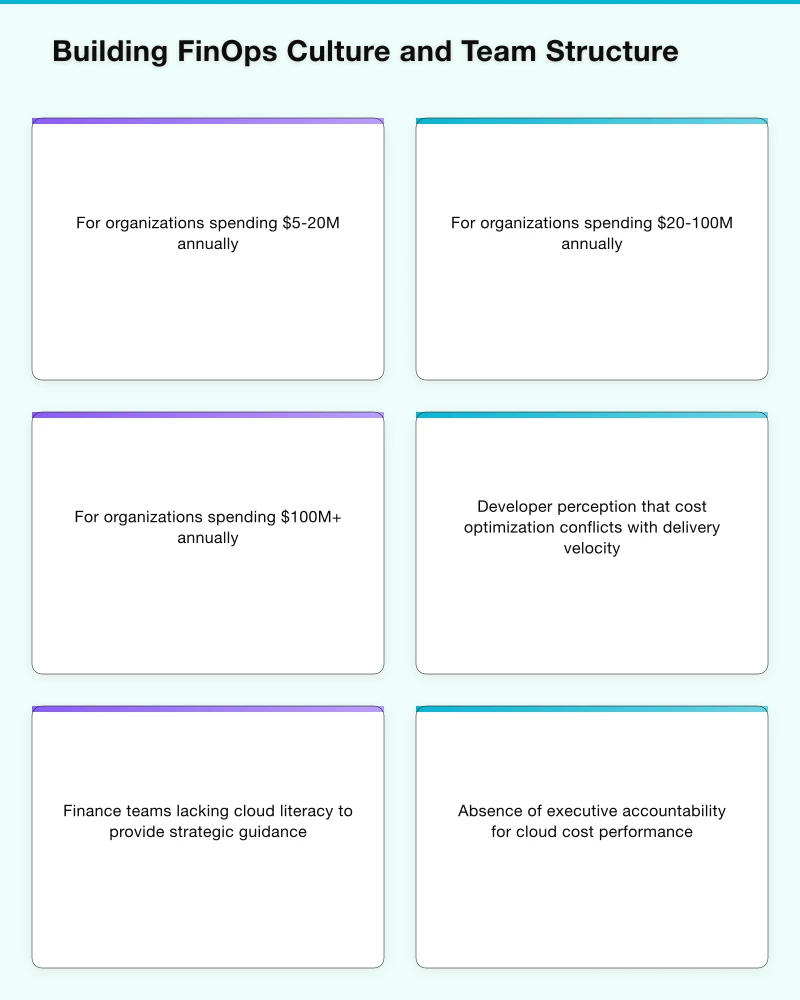
For organizations spending $100M+ annually: An enterprise FinOps function emerges with specialized roles. A Director of FinOps (reporting to CFO or CTO) leads a team that includes platform engineers, financial analysts, and FinOps practitioners embedded with major engineering teams. Larger organizations often establish a FinOps Center of Excellence that develops internal certification programs, maintains best practice repositories, and provides consultative support to engineering teams.
The team structure alone doesn’t create culture change. CTOs must address three cultural barriers that derail FinOps initiatives:
Developer perception that cost optimization conflicts with delivery velocity. This mindset stems from traditional IT environments where cost control meant delayed procurement and restricted access. In cloud environments, the inverse is often true: cost-optimized architectures frequently deliver better performance through right-sized resources, efficient data patterns, and modern compute services like serverless. Reframe cost optimization as engineering excellence, not financial constraint. When AWS Fargate reduces both cost and operational overhead compared to manually managed EC2 fleets, cost optimization aligns with technical objectives.
Finance teams lacking cloud literacy to provide strategic guidance. Traditional IT financial management revolves around predictable depreciation schedules and vendor contract negotiations. Cloud economics require understanding reserved capacity strategies, spot instance interruption patterns, and multi-region data transfer costs. Invest in cloud platform training for finance teams. Organizations that achieve “Operate” phase maturity typically require finance analysts to complete AWS Cloud Practitioner or equivalent certification, creating shared vocabulary with engineering teams.
Absence of executive accountability for cloud cost performance. When cloud spending appears as a single line item in departmental budgets, optimization remains a technical concern rather than a business imperative. Establish cloud cost efficiency as an executive KPI alongside traditional metrics like revenue growth and operational margin. Salesforce publicly reports its cloud infrastructure efficiency improvements in quarterly earnings—this executive visibility drives organizational accountability that cascading metrics cannot achieve.
The cultural transformation timeline typically extends 12-18 months. Early wins that demonstrate value accelerate adoption: identifying unused resources delivers immediate savings, implementing basic rightsizing shows ongoing optimization potential, and establishing showback reporting creates cost awareness. These tactical successes build credibility for larger architectural and organizational changes.
FinOps Tooling Strategy and Platform Selection
The FinOps tooling landscape has matured significantly, creating both opportunity and complexity for CTOs building platforms. The strategic question isn’t which single tool to deploy—it’s how to architect a tooling ecosystem that balances native cloud capabilities, third-party platforms, and custom automation.
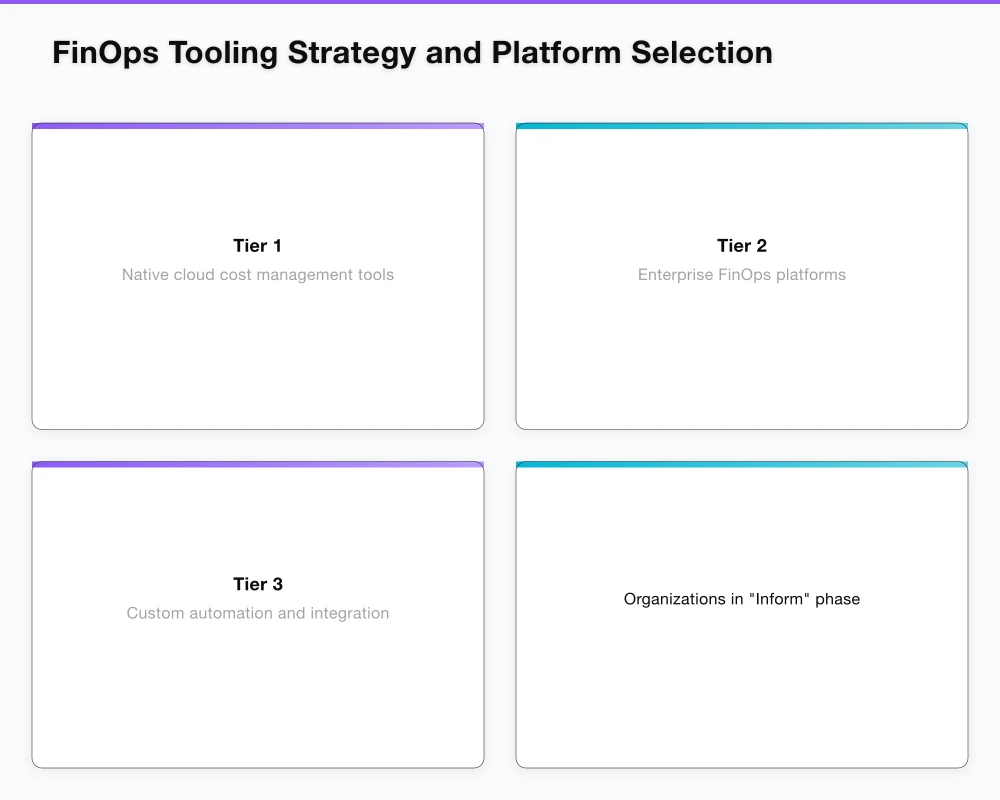
Most enterprises operate a three-tier FinOps tooling architecture:
Tier 1: Native cloud cost management tools form the foundation. AWS Cost Explorer, Azure Cost Management, and Google Cloud Cost Management provide baseline visibility, basic allocation, and fundamental optimization recommendations at no additional cost. These tools integrate directly with billing data, offer API access for custom reporting, and deliver service-specific insights that third-party tools cannot match.
The limitation: native tools operate within single-cloud boundaries. For multi-cloud environments—which now represent 87% of enterprise organizations according to recent Flexera research—native tools create visibility gaps and reporting inconsistency.
Tier 2: Enterprise FinOps platforms deliver cross-cloud normalization, advanced analytics, and collaborative workflows. The market divides into three categories:
Cloud-native platforms like AWS Cost Anomaly Detection and Azure Advisor focus on deep integration with specific cloud providers, offering AI-driven recommendations and automated optimization actions. These excel in single-cloud environments but require multiple tools for comprehensive multi-cloud visibility.
Multi-cloud FinOps platforms like CloudHealth (VMware), Apptio Cloudability, and Flexera provide unified cost visibility across AWS, Azure, and GCP. These platforms excel at cost allocation, showback/chargeback models, and executive reporting. Enterprise implementations typically cost $100K-500K annually depending on cloud spend, with ROI achieved through 8-12% cost reduction in the first year. The strategic value extends beyond savings: unified tagging governance, policy-driven automation, and predictive cost modeling capabilities that native tools lack.
Open-source alternatives like Kubecost (Kubernetes-focused) and Cloud Custodian (policy automation) address specific use cases with lower licensing costs but higher engineering overhead. These tools work well for organizations with strong platform engineering capabilities and specific requirements that commercial platforms don’t address.
Tier 3: Custom automation and integration completes the architecture. Even with enterprise platforms, organizations develop custom automation for their specific workflows: Slack/Teams integration for cost anomaly alerts, Jira integration for optimization task tracking, custom dashboards that combine cloud costs with application performance metrics, and CI/CD integration that provides cost estimates during deployment pipelines.
Platform selection should follow a maturity-aligned approach:
Organizations in “Inform” phase should maximize native cloud tools before adding platform costs. Implement comprehensive tagging strategies, establish basic cost allocation, and build executive reporting using native tool APIs. This foundation typically takes 3-6 months and requires minimal licensing investment.
Organizations transitioning to “Optimize” phase benefit from multi-cloud platforms when cloud spend exceeds $5M annually or when operating across multiple clouds. The business case centers on engineering efficiency: automated optimization recommendations that would require 1-2 FTE to generate manually, unified reporting that eliminates multi-cloud reconciliation overhead, and policy enforcement that prevents cost anomalies.
Organizations reaching “Operate” phase should invest in custom automation that embeds cost optimization into development workflows. This includes pre-deployment cost estimation, automated rightsizing implementation, and integration with observability platforms that correlate cost with performance. These capabilities typically require 1-2 platform engineers focused on FinOps automation.
The tooling anti-pattern to avoid: selecting enterprise platforms before establishing organizational readiness. A $300K annual platform investment delivers minimal ROI without cost allocation frameworks, engineering engagement, and defined optimization workflows. Technology amplifies organizational capability—it doesn’t create it.
Measuring FinOps ROI and Key Performance Indicators
FinOps program success requires metrics that translate technical optimization into business outcomes. The challenge for CTOs: traditional IT metrics like “percentage of reserved instances” or “number of rightsizing recommendations implemented” don’t communicate value to CFOs and board members evaluating cloud investment efficiency.
Effective FinOps measurement operates across three metric tiers:
Executive KPIs communicate business impact and should appear in quarterly business reviews:
Cloud unit economics measures cost per business outcome rather than absolute spend. For SaaS companies, this might be cloud cost per active user or cost per transaction. For e-commerce, cost per order processed. These metrics normalize for business growth—a 15% increase in cloud spending paired with 25% revenue growth demonstrates improving efficiency. Benchmarking shows high-performing organizations reduce unit economics 15-25% annually while scaling usage.
Cloud cost as percentage of revenue provides trend visibility and competitive context. While ratios vary by industry and business model, technology companies typically target 15-25% for established products and accept higher ratios during growth phases. The strategic insight comes from trend analysis: improving or degrading ratios signal architectural efficiency or technical debt accumulation.
Savings realization rate measures the percentage of identified optimization opportunities actually implemented. Organizations in mature FinOps programs achieve 70-85% realization rates—identifying $1M in potential savings and implementing $700K-850K through a combination of automated and manual optimization. Low realization rates (below 50%) typically indicate organizational barriers: lack of engineering capacity, resistance to change, or misaligned incentives.
Operational metrics track program health and should inform monthly FinOps team reviews:
Cost allocation coverage measures the percentage of cloud spending mapped to specific teams, products, or cost centers. Organizations should target 95%+ coverage, with unallocated spending limited to shared services and foundational infrastructure. Low allocation coverage prevents accurate showback/chargeback and eliminates accountability for cost management.
Commitment coverage tracks the percentage of predictable workloads covered by reserved capacity or savings plans. High-maturity organizations achieve 60-75% commitment coverage, balancing discount optimization with architectural flexibility. This metric requires industry context—organizations with seasonal workloads or rapid growth trajectories may intentionally maintain lower commitment coverage.
Cost anomaly detection and resolution time measures how quickly teams identify and respond to unexpected cost increases. Leading organizations detect 95%+ of material anomalies (typically defined as >20% unexpected increase) within 24 hours and resolve them within 5 business days. This metric indicates both tooling effectiveness and organizational responsiveness.
Technical metrics inform engineering team optimization priorities:
Waste identification quantifies spending on unused or underutilized resources: stopped instances still incurring storage costs, over-provisioned databases running at <20% utilization, or orphaned resources like unattached EBS volumes. Mature FinOps programs maintain waste below 5% of total spending through automated cleanup policies and regular auditing.
Rightsizing opportunity measures potential savings from matching resource sizes to actual utilization patterns. Most organizations initially identify 20-30% potential savings from rightsizing, with ongoing opportunity of 8-12% as workloads evolve. The metric should track both identified opportunity and implementation rate.
Architecture efficiency trends correlate cost with performance metrics. For example, cost per API request, storage cost per GB of data accessed, or compute cost per batch job completed. These metrics identify architectural improvements that reduce both cost and improve performance—often the highest-value optimization opportunities.
The measurement framework should evolve with program maturity. Organizations in “Inform” phase focus on establishing baseline metrics and cost allocation coverage. “Optimize” phase emphasizes savings identification and realization rates. “Operate” phase shifts toward unit economics and architecture efficiency trends that drive strategic decision-making.
One critical measurement principle: avoid vanity metrics that create misaligned incentives. “Total dollars saved” encourages cost reduction over value creation. “Percentage of cloud spending optimized” creates pressure to optimize even where optimization doesn’t deliver business value. Frame metrics around efficiency and unit economics rather than absolute cost reduction.
Strategic Implementation Roadmap
CTOs building FinOps capabilities face a common tension: the business expects rapid ROI while sustainable transformation requires 18-36 months. The solution lies in a phased implementation that delivers quick wins while establishing long-term capability.
Months 1-3: Foundation and Quick Wins
Establish the FinOps team structure and secure executive sponsorship. At minimum, identify a FinOps lead and allocate 0.5 FTE from finance and engineering. This team should report to the CTO or CFO with quarterly updates to executive leadership.
Implement comprehensive cost allocation tagging across all cloud environments. This foundational work enables every subsequent FinOps capability. Use the native tagging capabilities in AWS, Azure, and GCP to identify cost centers, product teams, environment types (production vs. development), and applications. Target 80%+ allocation coverage within 90 days.
Execute high-visibility optimization projects that demonstrate program value: identify and eliminate unused resources (stopped instances, orphaned storage, abandoned projects), implement automated shutdown for non-production resources outside business hours, and review and rightsize obviously over-provisioned databases and compute instances. These initiatives typically deliver 8-15% cost reduction with minimal risk.
Months 4-9: Optimization and Tooling
Deploy the FinOps platform selected based on organizational scale and multi-cloud requirements. This typically requires 4-8 weeks for implementation, integration, and training. Establish monthly cost review meetings with engineering leadership using platform reporting.
Implement initial reserved capacity or savings plan strategy for predictable workloads. Conservative approach: commit to 40-50% coverage for well-understood workloads with stable usage patterns. This typically delivers 15-25% discount on committed spending with minimal commitment risk.
Develop showback reporting that provides product and engineering teams visibility into their cloud spending patterns. Showback (visibility without billing) precedes chargeback (actual cost allocation to P&L) and creates cost awareness without organizational disruption. Use showback reporting to identify teams for deeper optimization partnership.
Months 10-18: Operating Model and Culture
Transition from centralized optimization to embedded FinOps practices. Train engineering teams on cost-aware architecture patterns, implement cost estimation in deployment pipelines, and establish cost efficiency as a standard consideration in architecture review processes.
Implement chargeback models where appropriate. Organizations with business unit P&L structures benefit from chargeback that creates direct financial accountability. This organizational change requires executive alignment and typically phases in over 2-3 quarters.
Develop predictive cost modeling capabilities that forecast spending based on business growth assumptions. This shifts FinOps from reactive cost management to strategic capacity planning. Mature organizations integrate cost forecasting into annual planning processes and quarterly business reviews.
Months 18+: Continuous Improvement and Strategic Value
At organizational maturity, FinOps evolves from cost management program to strategic capability that informs technology decisions. Advanced capabilities include:
Architecture optimization that considers total cost of ownership across development velocity, operational overhead, and cloud spending. This holistic view often identifies opportunities where higher cloud costs reduce overall delivery costs through improved developer productivity.
Sustainability metrics integration that combines cost optimization with carbon footprint reduction. Cloud providers now offer carbon accounting APIs that enable optimization for both cost and environmental impact—increasingly relevant as organizations face ESG reporting requirements.
Multi-year commitment strategy that leverages enterprise discount programs (AWS Enterprise Discount Program, Azure Enterprise Agreement, GCP Committed Use Discounts) to achieve 30-40% discounts on baseline spending. These commitments require sophisticated cost forecasting and executive risk tolerance but deliver material P&L impact at scale.
Conclusion: FinOps as Competitive Advantage
The organizations achieving sustained competitive advantage in cloud economics share a common characteristic: they view FinOps not as cost reduction initiative but as operating model for cloud-native business. When Spotify reduced cloud infrastructure costs by $10M annually while scaling to 500M users, the value wasn’t the savings—it was the architectural discipline that enabled profitable scaling. When Capital One invested in FinOps capabilities as part of their AWS migration, the ROI came from engineering velocity and innovation capacity, not just infrastructure efficiency.
For CTOs building FinOps programs in 2024, the strategic opportunity extends beyond the immediate 15-25% cost optimization that programs typically deliver. FinOps creates organizational capabilities that compound over time: engineering teams that instinctively design cost-efficient architectures, finance teams that understand cloud economics well enough to inform strategic decisions, and executive leadership that views cloud spending as investment portfolio requiring active management rather than technology expense requiring periodic reduction.
The organizations that embed these capabilities now will operate with structural cost advantage as cloud becomes increasingly central to every business function. The question isn’t whether to implement FinOps—it’s whether to build the capability before or after competitors establish the advantage.
Ash Ganda is a technology executive and strategic advisor specializing in enterprise cloud transformation and digital strategy. Connect on LinkedIn to discuss FinOps implementation strategies.
Need to put cloud strategy into action? Cloud Geeks provides in-depth guides on AWS, Azure, and cybersecurity for Australian SMBs.
These insights are drawn from my work leading Ganda Tech Services — helping Australian businesses navigate digital transformation through cloud, web, and mobile.
About the Author
Ashish Ganda is the founder of Ganda Tech Services, a Sydney-based technology consultancy specialising in cloud infrastructure, web development, and mobile app solutions for Australian businesses.
Digital Transformation Roadmap 2026
A 12-month framework for Australian SMBs ready to modernise — phases, tools, and milestones.