FinOps: Building a Cloud Cost Culture in Enterprise Organizations
Cloud spending in enterprise organizations is reaching an inflection point. With global cloud expenditure projected to exceed $675 billion in 2024 according to Gartner, CTOs are facing unprecedented pressure to demonstrate ROI on cloud investments while maintaining agility. The challenge isn’t just technical—it’s organizational. FinOps represents not just a methodology, but a fundamental shift in how enterprises approach cloud economics.
The traditional approach to cloud cost management—retrospective cost reviews and periodic budget reconciliation—is no longer sufficient. Leading enterprises are implementing FinOps frameworks that embed financial accountability into engineering workflows, creating a culture where cost optimization is as natural as security or performance considerations. This isn’t about restricting cloud usage; it’s about creating visibility, accountability, and strategic alignment between finance, engineering, and business units.
The Enterprise FinOps Operating Model
FinOps at enterprise scale requires a dedicated organizational structure that spans traditional departmental boundaries. The FinOps Foundation’s framework defines three core phases—Inform, Optimize, and Operate—but successful enterprise implementation demands specific organizational models that can sustain these practices.
The Centralized FinOps Team Model positions a dedicated cross-functional team as the center of excellence. At enterprises like Adobe and Walmart, centralized FinOps teams typically include cloud financial analysts, platform engineers with deep cloud architecture knowledge, and business relationship managers who bridge to product teams. This team owns the tooling, establishes standards, and provides consultative support. The centralized model excels at creating consistent practices across diverse business units and maintaining relationships with cloud vendors for enterprise discount programs and reserved capacity planning.
Adobe’s centralized FinOps team, for example, manages over $100M in annual cloud spending across AWS, Azure, and GCP. Their team of 12 specialists provides weekly cost reviews with product teams, maintains a self-service cost analytics platform, and negotiates enterprise discount programs that have yielded 23% savings on compute costs. The key to their success is that the FinOps team has authority to set policies but operates as advisors, not gatekeepers—product teams retain autonomy within defined guardrails.
The Federated FinOps Model distributes financial responsibility directly to engineering teams while maintaining centralized governance. In this model, each product or platform team has designated FinOps champions who participate in a cross-organizational FinOps guild. Capital One has successfully implemented this approach across their cloud-native infrastructure, with FinOps champions in each of their 50+ product teams. These champions receive specialized training, have access to centralized tooling and dashboards, and participate in monthly FinOps guild meetings to share best practices and address systemic issues.
The federated model requires significant investment in tooling and enablement. Capital One’s FinOps platform provides real-time cost visibility at the microservice level, automated anomaly detection, and integrated recommendations from their cloud optimization engine. Each product team has a monthly cloud budget tracked as a P&L line item, with variance analysis incorporated into sprint retrospectives. This creates direct ownership—teams that optimize costs can reinvest savings into features or additional capacity.
The Hybrid Model combines centralized expertise with distributed execution. Spotify’s approach exemplifies this: a central FinOps team of 8 specialists manages vendor relationships, reservation purchasing, and enterprise tooling, while 150+ squads have embedded “cloud cost ambassadors” who champion optimization within their teams. The central team sets targets (cost per stream, cost per user), provides self-service tools, and creates gamification leaderboards that recognize top-performing squads. Individual squads are responsible for achieving their targets through architecture optimization, resource right-sizing, and efficient workload placement.
Implementing Cost Allocation and Chargeback Systems
Effective cost allocation is the foundation of FinOps culture. Without clear visibility into which business units, products, or projects are consuming cloud resources, optimization efforts lack strategic direction. Enterprise-grade cost allocation requires robust tagging strategies, allocation methodologies, and chargeback mechanisms.
Tagging Strategy and Governance forms the technical backbone of cost allocation. Leading enterprises implement mandatory tagging policies enforced through infrastructure-as-code and automated compliance checks. A comprehensive enterprise tagging taxonomy typically includes:
- Business dimension: Business unit, cost center, budget owner
- Technical dimension: Environment (prod/staging/dev), application, microservice, data classification
- Operational dimension: Managed by (team), support tier, backup policy
- Financial dimension: Charge code, project ID, capital vs. operational expense classification
General Electric’s cloud platform requires 12 mandatory tags on all resources, enforced through AWS Service Control Policies and Azure Policy. Resources without complete tags are automatically flagged, and teams have 48 hours to remediate before automated shutdown of non-production resources. This strict governance ensures that 98% of their $200M+ annual cloud spend is accurately allocated.
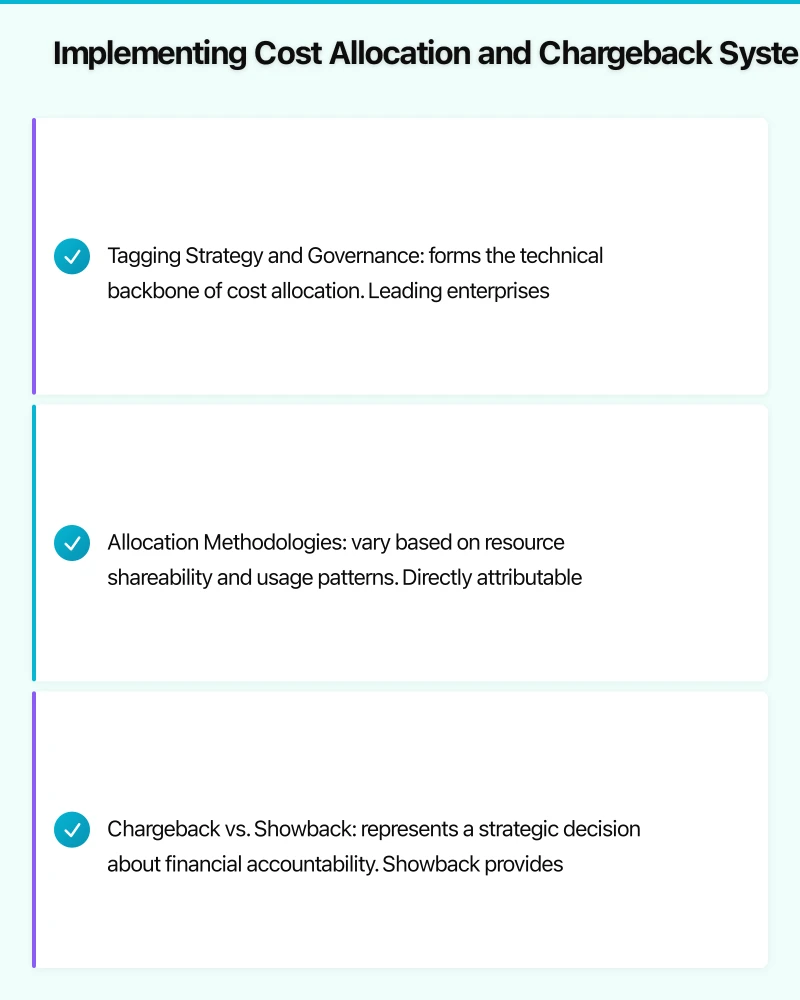
Allocation Methodologies vary based on resource shareability and usage patterns. Directly attributable costs—dedicated EC2 instances, S3 buckets with clear ownership, application-specific databases—are straightforward to allocate based on tags. Shared services require more sophisticated approaches:
Proportional allocation distributes shared service costs based on usage metrics. A shared Kubernetes cluster’s costs might be allocated based on pod CPU/memory requests, actual utilization, or namespace-based resource quotas. Netflix allocates their shared data platform costs proportionally based on data processed and queries executed by each product team.
Fixed allocation assigns shared infrastructure costs based on predetermined percentages or capacity reservations. This approach works well for shared networking infrastructure, centralized logging platforms, or security services where usage correlation is complex. The trade-off is reduced precision but simplified implementation and predictable chargeback.
Tiered allocation creates internal “service tiers” with published pricing for shared services. Teams consuming a shared CI/CD platform might be charged based on build minutes consumed, with tiered pricing that incentivizes efficient build practices. HashiCorp uses this model internally for their shared Terraform Enterprise platform, charging teams based on workspace count and monthly runs.
Chargeback vs. Showback represents a strategic decision about financial accountability. Showback provides visibility without actual fund transfers—business units see their cloud costs allocated in reports and dashboards, creating awareness and enabling conversations about optimization. Chargeback goes further, transferring costs to business unit budgets and making cloud spending impact unit P&L statements.
Lyft operates with full chargeback for product teams but showback for platform teams. Product teams have cloud costs directly charged to their departmental budgets, creating strong incentives for optimization. Platform teams providing shared infrastructure receive showback reports that inform capacity planning and service design, but costs remain centralized to avoid disincentivizing use of standardized platforms.
The progression from showback to chargeback typically takes 12-18 months in large enterprises. Initial showback implementations create awareness and establish data quality. As tagging coverage exceeds 95% and allocation methodologies mature, selective chargeback for the largest cost centers can be introduced. Full chargeback requires mature processes, accurate data, and organizational readiness to handle budget implications.
Building Sustainable Cloud Cost Culture
Technology and process frameworks enable FinOps, but culture determines whether it becomes sustainable or remains a compliance exercise. Transforming engineering culture to embrace cost consciousness requires leadership commitment, behavioral incentives, and systematic enablement.
Executive Sponsorship and Metrics establish FinOps as a strategic priority. At Intuit, the CTO and CFO jointly sponsor the FinOps program, with cloud unit economics (cost per transaction, cost per user) included in quarterly business reviews alongside traditional availability and performance metrics. This executive visibility signals that cost optimization is as important as feature delivery.
Effective FinOps metrics balance absolute cost control with business value creation. Tracking total cloud spend in isolation can create perverse incentives—teams might optimize costs by sacrificing performance, reliability, or development velocity. Leading enterprises track efficiency metrics:
- Cost per transaction for transactional systems (e-commerce, payments)
- Cost per user for SaaS platforms
- Cost per data point for analytics and ML platforms
- Infrastructure cost as % of revenue for the overall business
- Cost efficiency trend tracking cost growth relative to usage growth
Pinterest’s engineering team tracks “cost per MAU” (monthly active user) as a North Star metric. Their goal isn’t to minimize absolute cloud spending but to reduce cost per MAU by 15% year-over-year while maintaining 99.9% availability. This frames optimization as an engineering challenge that enables business scale rather than a budget-cutting exercise.
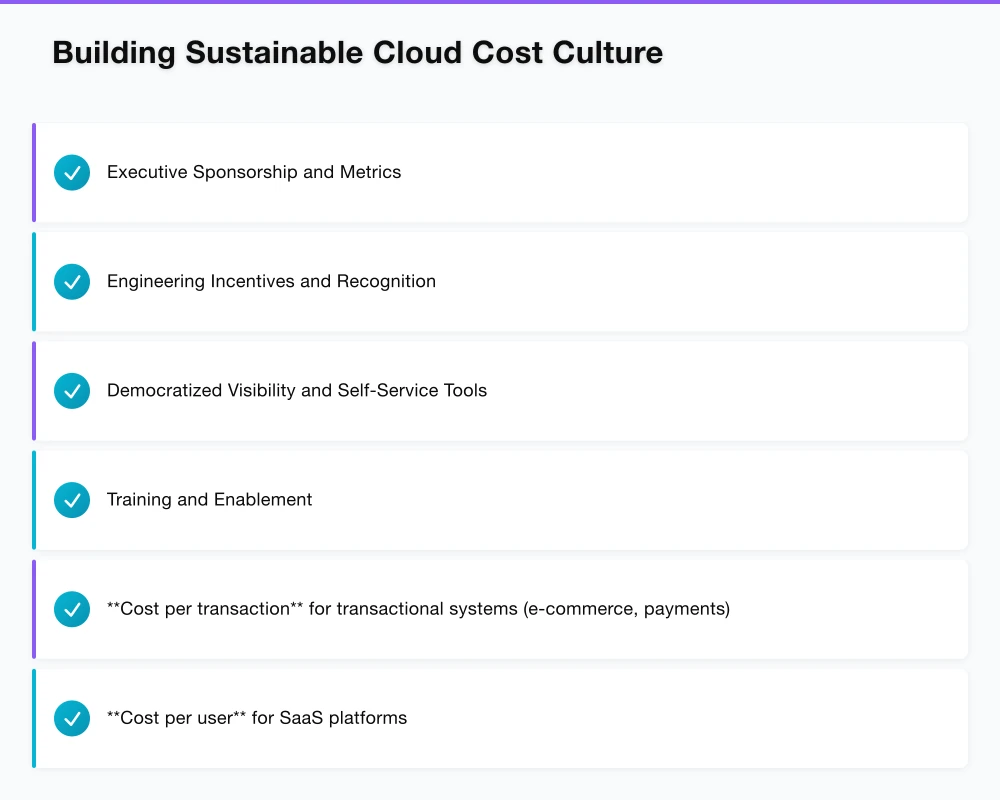
Engineering Incentives and Recognition make cost optimization visible and rewarding. Traditional engineering incentive structures reward feature delivery and uptime but rarely recognize cost efficiency. Progressive organizations are incorporating cost optimization into performance reviews, promotion criteria, and team recognition programs.
Atlassian’s “Cloud Efficiency Heroes” program recognizes teams and individuals who deliver significant cost optimizations. Quarterly awards highlight specific optimization initiatives—a team that reduced data transfer costs by 40% through architectural redesign, an engineer who identified and eliminated $50K/month in zombie resources. These stories are shared in company-wide engineering updates, making cost optimization a celebrated engineering achievement rather than a finance mandate.
Spotify incorporates “cost efficiency” as one of four dimensions in their engineering career ladder, alongside traditional technical depth, impact, and leadership criteria. Engineers at senior levels are expected to demonstrate awareness of cost implications in architectural decisions and actively participate in optimization initiatives. This embeds financial thinking into the core expectations of engineering excellence.
Democratized Visibility and Self-Service Tools empower engineers to understand and optimize costs. In organizations where cost data is locked in finance dashboards or accessed through ticket-based requests, engineers remain disconnected from financial impact. Leading FinOps implementations provide real-time, granular cost visibility directly in developer workflows.
Amazon’s internal “Cost Insights” dashboard is accessible to every engineer, providing service-level cost breakdown, trend analysis, and per-API cost metrics. Engineers can see the cost impact of their services in the same interface where they monitor performance metrics. Anomaly detection alerts trigger automatically when costs exceed expected patterns, enabling rapid response to configuration errors or unexpected usage spikes.
GitHub integrates cost visibility into their deployment pipeline. When engineers propose infrastructure changes through pull requests, automated cost estimation tools project the monthly cost impact of the proposed changes. A PR adding new compute capacity shows estimated costs before merge, making financial implications visible at decision-time rather than discovered in retrospective cost reviews.
Training and Enablement builds FinOps competency across engineering teams. Cloud cost optimization requires specific knowledge—understanding cloud pricing models, identifying optimization opportunities, and implementing architectural patterns for cost efficiency. Organizations with mature FinOps cultures invest in systematic enablement.
Salesforce’s “Cloud Economics” training program is mandatory for all engineers joining cloud infrastructure teams and recommended for application developers. The 8-hour course covers cloud pricing fundamentals, reserved capacity strategies, architectural patterns for cost optimization, and hands-on labs using their internal cost analytics platform. Over 3,000 engineers have completed the training since its launch in 2022.
Beyond formal training, knowledge sharing through internal communities and office hours accelerates learning. Slack’s FinOps office hours provide weekly opportunities for engineering teams to get consultation on specific optimization challenges. The FinOps team maintains an internal knowledge base with runbooks for common optimizations—right-sizing EC2 instances, optimizing S3 storage classes, implementing auto-scaling policies.
Tactical Optimization Strategies for Enterprise Scale
Strategic culture and organizational models enable FinOps, but tactical optimization delivers measurable impact. Enterprise-scale optimization requires systematic approaches that can be applied across diverse workloads and teams.
Reserved Capacity and Commitment Discounts represent the highest-impact optimization for stable workloads. AWS Reserved Instances, Azure Reserved VM Instances, and GCP Committed Use Discounts provide 30-70% savings compared to on-demand pricing. The challenge at enterprise scale is balancing commitment risk against discount opportunity.
Leading enterprises use portfolio approaches to capacity planning. Instead of individual teams purchasing reservations for their specific workloads, centralized FinOps teams analyze aggregate usage patterns and purchase reserved capacity at the organizational level. This pooling reduces commitment risk—temporary decreases in one workload’s demand can be absorbed by growth in others.
Airbnb’s capacity planning process runs quarterly analyses of the past 18 months of usage data, identifying the stable baseline across all workloads. They purchase 1-year and 3-year reserved instances to cover 70% of this baseline, leaving 30% on-demand for burst capacity and experimentation. This approach has reduced their compute costs by 42% while maintaining flexibility for rapid product iteration.
Spot and Preemptible Instance Strategies extend beyond traditional batch workloads. While spot instances were initially considered only for fault-tolerant batch processing, enterprises are increasingly using them for stateless web services, CI/CD infrastructure, and even production workloads with proper architectural patterns.
Lyft runs 30% of their production Kubernetes workload on AWS Spot Instances, saving approximately $8M annually. Their approach uses multi-AZ spot instance fleets with diverse instance types, automated failover to on-demand capacity when spot is interrupted, and graceful pod termination handling. Application teams don’t need spot-specific code—the infrastructure platform handles spot lifecycle management transparently.
Architectural Optimization delivers sustainable cost reduction through fundamental design improvements. Common architectural anti-patterns that drive excessive costs include:
Over-provisioned always-on environments: Development and staging environments that run 24/7 at production scale but are only actively used 40 hours per week. Implementing automated start/stop schedules for non-production environments typically saves 60-70% on those environments.
Monolithic data processing: Running large-scale data transformations on persistent compute clusters rather than serverless or ephemeral infrastructure. Migrating batch ETL jobs from always-on EMR clusters to AWS Glue or ephemeral clusters can reduce costs by 50-80% by paying only for actual processing time.
Inefficient data storage patterns: Storing all data in high-performance, expensive storage tiers regardless of access patterns. Implementing storage lifecycle policies that transition infrequently accessed data to cheaper storage classes (S3 Intelligent-Tiering, Azure Cool/Archive storage) commonly reduces storage costs by 40-60%.
Capital One’s “Well-Architected for Cost” program systematically reviews all major applications against a cost optimization framework. Each application undergoes quarterly architectural reviews examining resource sizing, storage tiering, network data transfer patterns, and serverless opportunities. This systematic approach has identified $30M in annual optimizations across their cloud portfolio.
Measuring FinOps Maturity and Continuous Improvement
FinOps implementation is a journey, not a destination. The FinOps Foundation’s maturity model defines progression from initial reactive cost management through to fully optimized, autonomous operations. Understanding organizational maturity enables targeted improvement efforts.
Crawl Phase organizations have basic cost visibility and manual optimization processes. Cloud costs are reviewed monthly or quarterly in retrospective analyses. Tagging exists but coverage is incomplete. Optimization happens through periodic “cost reduction sprints” when budgets become constrained. Most enterprises beginning FinOps implementations operate in this phase.
Key crawl-phase objectives include establishing baseline cost visibility, implementing mandatory tagging policies, creating showback reports for major cost centers, and building the foundational FinOps team. Success at this phase means moving from “we don’t know what we’re spending” to “we can see and explain our cloud costs.”
Walk Phase organizations have systematic processes, proactive optimization, and embedded accountability. Cost is reviewed weekly in operational rituals. Automated systems detect anomalies and optimization opportunities. Chargeback or showback creates business unit accountability. Engineering teams have access to self-service cost tools and basic enablement.
Walk-phase capabilities include automated cost anomaly detection, systematic reserved capacity management, architectural cost reviews in design processes, and established optimization playbooks. Organizations at this maturity demonstrate consistent cost efficiency improvements quarter-over-quarter while maintaining or improving business metrics.
Run Phase organizations achieve autonomous, culturally embedded FinOps practices. Cost optimization is integrated into engineering culture and everyday workflows. Predictive analytics forecast future costs and identify optimization opportunities before they impact budgets. Unit economics are tracked in real-time and directly inform product and technical strategy.
Run-phase characteristics include real-time cost visibility in developer tools, automated optimization actions (auto-scaling, resource rightsizing), cost efficiency metrics in engineering performance reviews, and continuous optimization yielding 15-20% annual efficiency gains. Organizations at this maturity treat cost as a first-class architectural concern alongside performance, reliability, and security.
Strategic Imperatives for 2024
The FinOps landscape continues to evolve rapidly. Several emerging trends demand attention from enterprise technology leaders implementing or maturing their FinOps practices.
Multi-cloud cost optimization is becoming table stakes. Enterprises with workloads across AWS, Azure, and GCP need unified visibility and optimization across providers. Tools like CloudHealth, Flexera, and Vantage provide cross-cloud analytics, but organizational processes must also adapt. Best practices include centralized cloud vendor management, consistent tagging taxonomies across clouds, and platform teams that provide abstraction layers enabling workload portability based on cost and performance characteristics.
Container and Kubernetes cost management represents the next frontier. As enterprises standardize on Kubernetes for application platforms, traditional VM-based cost allocation breaks down. Container cost management requires new approaches—namespace-level allocation, pod cost attribution, shared cluster cost distribution. Tools like Kubecost and native cloud provider solutions (AWS EKS Cost Insights, GKE Cost Allocation) are maturing rapidly, but organizational processes need corresponding evolution.
Sustainability and carbon accounting is increasingly integrated with FinOps. The intersection of cloud cost management and environmental impact creates new imperatives. AWS Customer Carbon Footprint Tool, Azure Carbon Optimization, and GCP Carbon Footprint now provide carbon impact alongside cost data. Forward-thinking enterprises are beginning to track carbon efficiency metrics alongside financial metrics, recognizing that optimizing cloud efficiency delivers both cost and environmental benefits.
The path to sustainable cloud cost management requires balancing immediate tactical optimizations with strategic cultural transformation. Organizations that successfully implement FinOps don’t just reduce cloud spending—they create strategic advantages through efficient resource utilization, data-driven decision making, and engineering cultures that balance innovation with financial accountability. For CTOs leading this transformation, the question isn’t whether to implement FinOps, but how quickly you can build the organizational capabilities that will define competitive advantage in an increasingly cloud-centric technology landscape.
Ash Ganda is a technology strategist focused on enterprise cloud architecture and digital transformation. Connect on LinkedIn to discuss FinOps strategy and cloud economics.
If this strategic perspective has you thinking about cloud adoption, Cloud Geeks provides the implementation detail — from AWS setup to security hardening.
My consultancy Ganda Tech Services operates three specialist divisions covering cloud infrastructure, web development, and mobile apps for Australian businesses.
About the Author
Ashish Ganda is the founder of Ganda Tech Services, a Sydney-based technology consultancy specialising in cloud infrastructure, web development, and mobile app solutions for Australian businesses.
Tech Stack Selection Guide 2026
Choose the right tools for your Australian business — without the vendor hype or overlapping spend.