Enterprise Site Reliability Engineering: Implementing SLOs
Site Reliability Engineering has moved from a Google-specific practice to a mainstream enterprise discipline. The core SRE concept — defining reliability targets through Service Level Objectives (SLOs) and managing engineering effort through error budgets — provides a framework that aligns engineering, product, and business stakeholders around a shared understanding of reliability.
Yet many enterprise SLO implementations fail to deliver their intended value. SLOs are set arbitrarily, error budgets are ignored when they become inconvenient, and the practice devolves into another set of dashboards that no one acts on. The gap between understanding SLOs conceptually and implementing them effectively in a large organisation is significant.
Choosing Service Level Indicators
Service Level Indicators (SLIs) are the metrics that SLOs are built upon. Choosing the right SLIs is the most consequential decision in the SLO implementation process. The wrong SLIs produce SLOs that are technically met while users suffer, or technically violated while users are satisfied.
The foundational principle is that SLIs should measure what users experience, not what the system produces. Server CPU utilisation is not an SLI because users do not experience CPU utilisation. Request latency at the 99th percentile is an SLI because users directly experience slow responses.
For most services, four categories of SLIs cover the relevant user experience dimensions:
Availability: The proportion of valid requests that are served successfully. This is typically measured as the ratio of successful responses (HTTP 2xx and 3xx) to total responses, excluding client errors (HTTP 4xx) that reflect user mistakes rather than system failures. For enterprise services, the definition of “successful” may need to account for business logic — a payment service that returns HTTP 200 with a body indicating a processing failure is not truly successful.
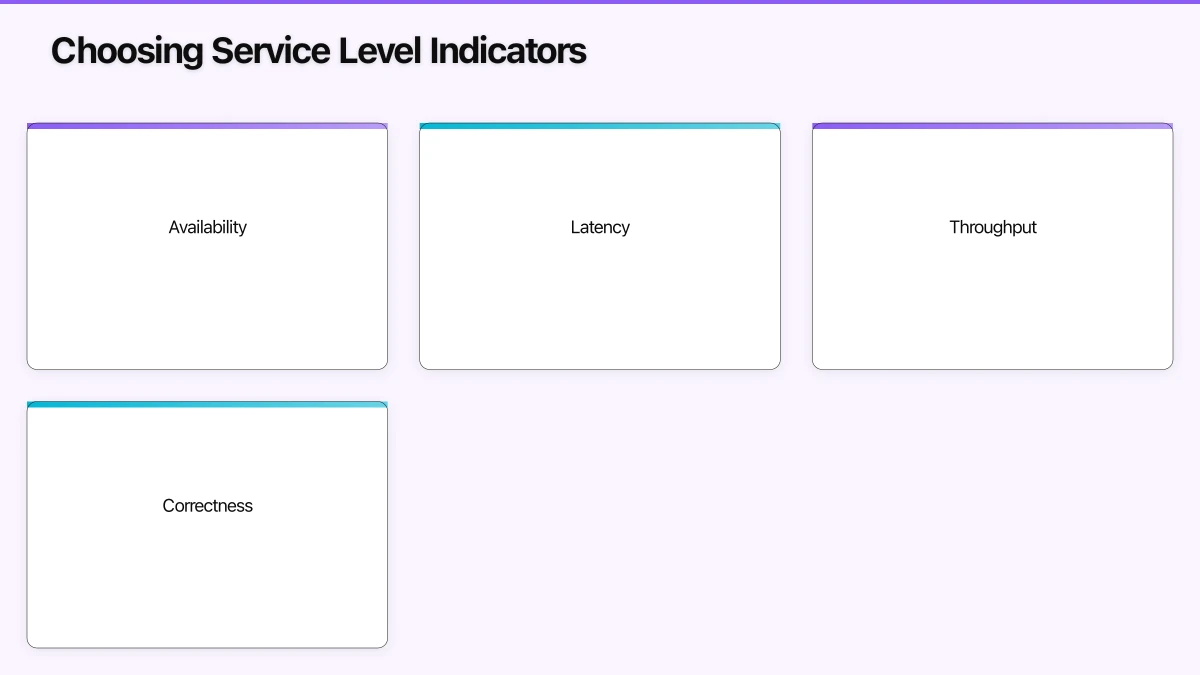
Latency: The distribution of response times for successful requests. Measuring latency at percentiles rather than averages is essential: a service with a 100ms average latency and a 5-second 99th percentile latency is delivering a terrible experience to one percent of users, which could represent thousands of people per day. The SLI should capture the latency that matters to users, typically the 50th (median), 95th, and 99th percentiles.
Throughput: For batch processing and data pipeline services, the rate at which work is completed. This is relevant when the service’s value depends on processing volume — a data ingestion pipeline that processes only half the expected events is failing its users even if each individual event is processed correctly.
Correctness: For services where response accuracy matters independently of availability and latency. A search engine that returns results quickly but with poor relevance is failing its users. A financial calculation service that returns timely but incorrect results is worse than unavailable. Correctness SLIs are domain-specific and require careful definition.
The selection of SLIs should involve the service owners, the product teams that depend on the service, and the end users or their representatives. An SLI that engineering considers important but users do not care about wastes measurement effort. An SLI that users consider critical but engineering does not measure leaves a blind spot.
Setting SLO Targets
With SLIs defined, the next step is setting the SLO target — the reliability level the service commits to delivering. This is where most organisations make their first mistake: setting targets of 99.99% or 99.999% because those numbers feel appropriate for enterprise services.
The correct SLO target is the minimum reliability level that keeps users satisfied, not the maximum reliability the system can achieve. This distinction is fundamental because every increment of reliability has increasing cost and decreasing marginal value.
The difference between 99.9% and 99.99% availability is not 0.09 percentage points — it is a tenfold reduction in allowed downtime, from 8.76 hours per year to 52.6 minutes per year. Achieving this requires redundancy, automated failover, sophisticated monitoring, and engineering investment that may not be justified by the user impact of the additional downtime.
Setting targets empirically: The best approach starts with historical data. If a service has historically delivered 99.95% availability and users are satisfied, an SLO of 99.9% provides a meaningful commitment while leaving room for the error budget to function. Setting the target at 99.99% when the service has never achieved that level sets the team up for failure and makes the error budget meaninglessly tight.
Differentiated targets: Not all requests are equal. A payment processing endpoint may warrant a 99.99% availability SLO, while a reporting dashboard may be acceptable at 99.5%. Differentiated SLOs that reflect the business impact of reliability failures produce better resource allocation than a single blanket target.
Iterative refinement: SLO targets should be reviewed quarterly or semi-annually based on user feedback, business impact data, and engineering cost analysis. An SLO that was appropriate when the service had a thousand users may need to be tightened when it serves a million. An SLO that was set conservatively should be tightened as the team gains confidence and capability.
Error Budgets: Making Reliability Actionable
The error budget is the gap between perfect reliability and the SLO target. A service with a 99.9% availability SLO has an error budget of 0.1% — approximately 43 minutes of downtime per month, or a budget of failed requests proportional to total request volume.
The error budget transforms reliability from a vague aspiration into a concrete, measurable resource. It answers the question that has historically caused tension between product and engineering teams: “Can we take this risk?”
If the error budget is healthy (the service has been significantly more reliable than its SLO), the team has earned the right to take risks — deploying new features rapidly, running experiments, making architectural changes. If the error budget is depleted or nearly so, the team should prioritise reliability work over feature development until the budget recovers.
Error budget policies: For the error budget to drive behaviour, the organisation needs explicit policies about what happens when the budget is consumed. These policies should be agreed upon by engineering, product, and business stakeholders before the error budget is under pressure. Common policy elements include:
When the error budget is healthy (over fifty percent remaining), the team operates normally with standard deployment velocity and risk tolerance.
When the error budget is under pressure (under thirty percent remaining), the team increases caution: larger changes receive additional review, deployments are more carefully monitored, and reliability improvements are prioritised.
When the error budget is exhausted, the team focuses exclusively on reliability until the budget recovers. No new features are deployed. All engineering effort goes toward preventing further budget consumption.
Organisational alignment: Error budget policies only work when they are endorsed by leadership. If product management can override the error budget policy when they want a feature shipped, the entire framework collapses. The CTO’s role is to establish the error budget as an organisational commitment, not a suggestion.
Scaling SLOs Across the Enterprise
Implementing SLOs for a single service is straightforward. Scaling the practice across an enterprise with hundreds of services requires additional infrastructure and process.
SLO tooling: Manual SLO tracking does not scale. The organisation needs automated systems that continuously calculate SLI values, compare them against SLO targets, compute remaining error budgets, and surface alerts when budgets are under pressure. Tools like Nobl9, Blameless, and open-source solutions built on Prometheus with recording rules provide this automation.
Dependency SLOs: In a microservices architecture, a service’s reliability depends on the reliability of its dependencies. If Service A depends on Services B and C, then A’s achievable reliability is constrained by B’s and C’s reliability. Understanding these dependency relationships helps set realistic SLOs and identify where reliability investments will have the greatest impact.
SLO reviews: Regular reviews of SLO performance across the service portfolio reveal patterns: which services consistently burn error budget (indicating systemic reliability issues), which services have unnecessarily tight SLOs (indicating wasted engineering effort), and which services have SLOs that do not align with user expectations (indicating measurement gaps).
SLOs are the mechanism through which enterprise engineering organisations make reliability visible, measurable, and manageable. They replace subjective arguments about reliability with data-driven decisions. They align engineering investment with user impact. And they provide the framework for balancing the competing demands of velocity and stability that every technology organisation faces. The CTO who implements SLOs effectively gains a powerful tool for managing one of the most challenging aspects of enterprise technology leadership.
Strategy needs execution. Cloud Geeks publishes practical cloud computing and cybersecurity guides for Australian businesses ready to act.
As founder of Ganda Tech Services, I work with Australian businesses to align technology investments with business growth — across cloud, web, and mobile.
About the Author
Ashish Ganda is the founder of Ganda Tech Services, a Sydney-based technology consultancy specialising in cloud infrastructure, web development, and mobile app solutions for Australian businesses.
Digital Transformation Roadmap 2026
A 12-month framework for Australian SMBs ready to modernise — phases, tools, and milestones.