
Engineering Metrics That Actually Matter: Beyond Lines of Code
In enterprise engineering organizations, the temptation to measure what’s easy rather than what’s meaningful remains one of the most persistent management antipatterns. Lines of code, commit counts, and story points closed create the illusion of objective performance assessment while obscuring the strategic outcomes that actually drive competitive advantage.
The reality facing CTOs in 2024 is more nuanced. As engineering teams scale beyond 50, 100, or 500 developers, the need for rigorous measurement intensifies precisely when traditional metrics lose their signal. Google’s Project Aristotle research and the ongoing DORA State of DevOps reports have demonstrated that high-performing engineering organizations measure fundamentally different things than their lower-performing counterparts—and that this measurement gap correlates directly with business outcomes.
This creates a strategic inflection point for technology executives. The metrics you choose don’t simply measure performance—they shape team behavior, resource allocation decisions, and ultimately determine whether your engineering organization becomes a competitive advantage or a scaling constraint.
The DORA Framework: Proven Metrics for Software Delivery Performance
The DevOps Research and Assessment (DORA) team, now part of Google Cloud, has established the most rigorously validated framework for measuring software delivery performance across enterprise organizations. Based on seven years of data from over 32,000 professionals, the four key metrics provide a balanced assessment of both velocity and stability.
Deployment Frequency measures how often code reaches production. Elite performers deploy multiple times per day, high performers deploy between once per day and once per week, medium performers deploy between once per week and once per month, and low performers deploy less frequently than monthly. This metric captures an organization’s ability to deliver value continuously rather than in large, risky batches.
Lead Time for Changes tracks the time from code committed to code running in production. Elite performers achieve lead times under one hour, high performers under one day, medium performers between one day and one week, and low performers between one month and six months. Short lead times indicate efficient deployment pipelines and the ability to respond rapidly to market feedback.
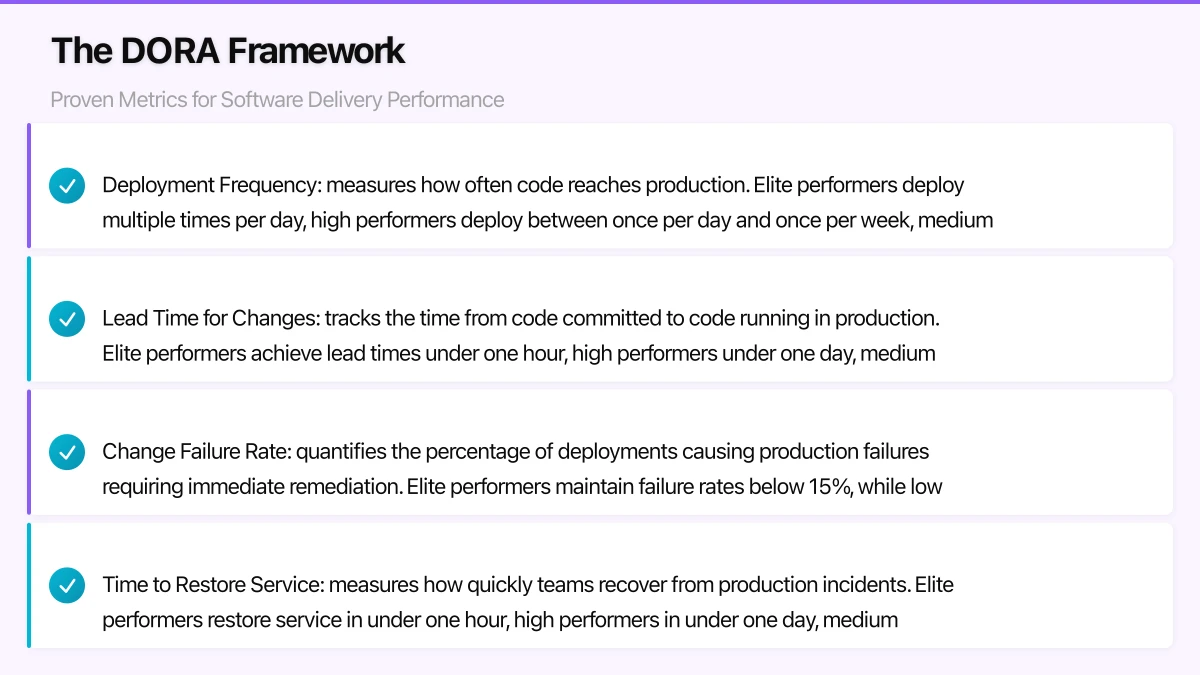
Change Failure Rate quantifies the percentage of deployments causing production failures requiring immediate remediation. Elite performers maintain failure rates below 15%, while low performers experience failures in 46-60% of deployments. This metric prevents the dangerous pattern of optimizing for speed while sacrificing reliability.
Time to Restore Service measures how quickly teams recover from production incidents. Elite performers restore service in under one hour, high performers in under one day, medium performers in under one week, and low performers require more than one week. Fast recovery times indicate strong incident response processes and architectural resilience.
The strategic value of these metrics lies in their correlation with business outcomes. Organizations scoring well across all four DORA metrics are twice as likely to exceed profitability, market share, and productivity goals according to the 2023 Accelerate State of DevOps Report. They also report 50% higher developer productivity and significantly lower burnout rates.
For enterprise implementation, DORA metrics require instrumentation across your CI/CD pipeline and incident management systems. Tools like GitLab, GitHub Actions, CircleCI, and Jenkins can track deployment frequency and lead time when properly configured. Change failure rate and time to restore typically require integration with monitoring platforms like Datadog, New Relic, or PagerDuty. The measurement infrastructure itself becomes a competitive advantage—organizations that can accurately measure these metrics have typically also invested in the automation necessary to improve them.
Developer Productivity: Beyond Output to Outcomes
While DORA metrics assess delivery performance, developer productivity requires measuring the environment and systems that enable effective work. The fundamental error in productivity measurement is conflating activity with effectiveness—developers can appear busy while producing minimal business value if constrained by inefficient systems.
Developer Experience (DevEx) frameworks, pioneered by companies like Spotify and Microsoft, focus on reducing friction in the development lifecycle. Key indicators include build and test cycle times, environment provisioning speed, and time spent on undifferentiated work versus feature development. Microsoft’s research shows that developers spend only 36% of their time on actual coding, with the remainder consumed by meetings, code reviews, testing, and tooling issues.
Measuring cycle time by work stage reveals systemic bottlenecks. Track time from story creation to development start (queue time), development start to pull request (active development time), pull request creation to approval (review time), and approval to production deployment (deployment time). High-performing teams show balanced distributions, while problematic patterns emerge when specific stages dominate—excessive queue time indicates planning or prioritization issues, extended review time suggests insufficient automation or team capacity constraints.
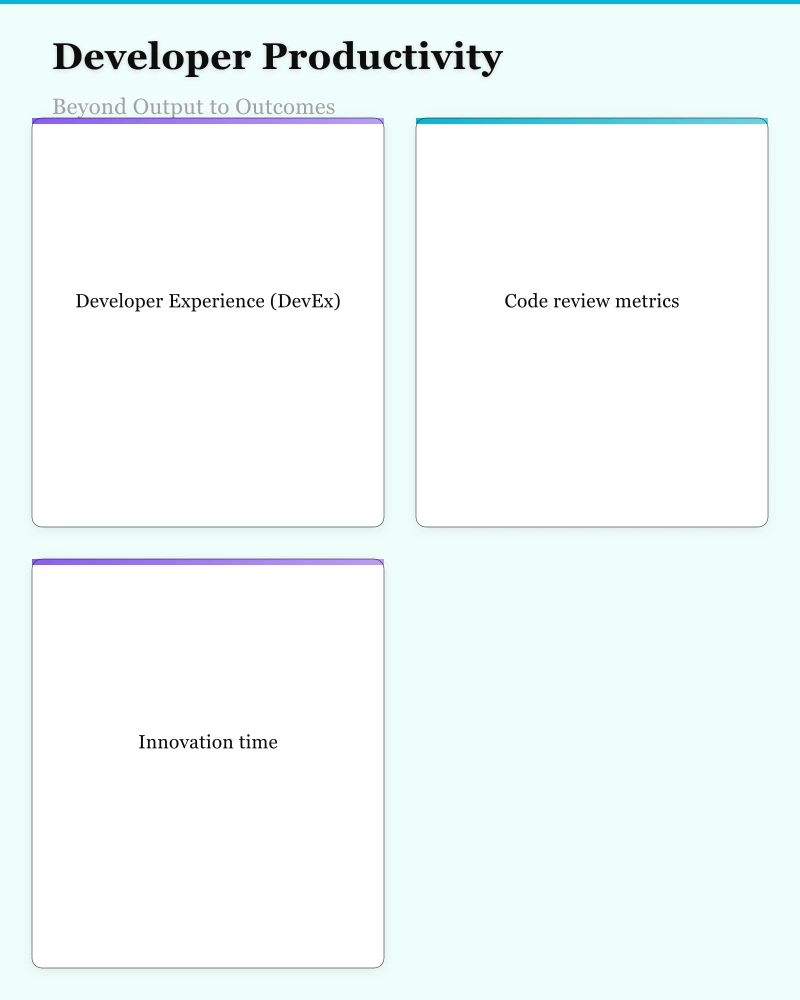
Code review metrics require particular nuance. Time to first review and time to merge matter significantly for developer flow and feature velocity. However, measuring number of comments or approval rates creates perverse incentives. Focus instead on whether reviews happen within SLA windows (typically 24 hours for standard PRs, 4 hours for urgent fixes) and whether review backlogs remain manageable. GitHub’s analysis of their own engineering organization found that PRs reviewed within 24 hours merge 75% faster than those with delayed initial review.
Innovation time provides a counterbalance to delivery velocity metrics. Google’s famous 20% time, 3M’s 15% rule, and Atlassian’s ShipIt days reflect a broader principle: engineering organizations need dedicated capacity for technical debt reduction, architectural improvements, and exploratory work. Measure this as percentage of sprint capacity allocated to non-feature work, targeting 15-25% for sustainable engineering teams.
The Infrastructure team at Stripe publicly shared their productivity framework in early 2024, measuring developer wait time across common workflows. They found that reducing test suite runtime from 45 minutes to 15 minutes yielded an effective 8% increase in engineering capacity—the equivalent of hiring 40 additional developers for their 500-person engineering organization. This illustrates how productivity improvements compound across large teams.
Team Health and Sustainability Metrics
Sustainable performance requires measuring the human systems alongside technical delivery. Engineering organizations that ignore team health metrics inevitably face retention crises, knowledge loss, and declining innovation as burnout accelerates.
On-call burden serves as an early indicator of operational health and team sustainability. Track the frequency of after-hours pages, time spent responding to incidents, and percentage of on-call shifts with significant interruptions. Google’s Site Reliability Engineering book recommends limiting operational work to 50% of SRE time, with the remainder dedicated to engineering improvements. When on-call burden exceeds this threshold, teams lack capacity for the reliability work that would reduce future incidents.
Research from the University of California analyzing developer activity patterns found that engineers averaging more than 2 hours of after-hours work per week show 32% higher turnover within 12 months. This correlation strengthens when after-hours work is reactive (incident response) rather than proactive (scheduled deployments). Measure both frequency and nature of out-of-hours work.
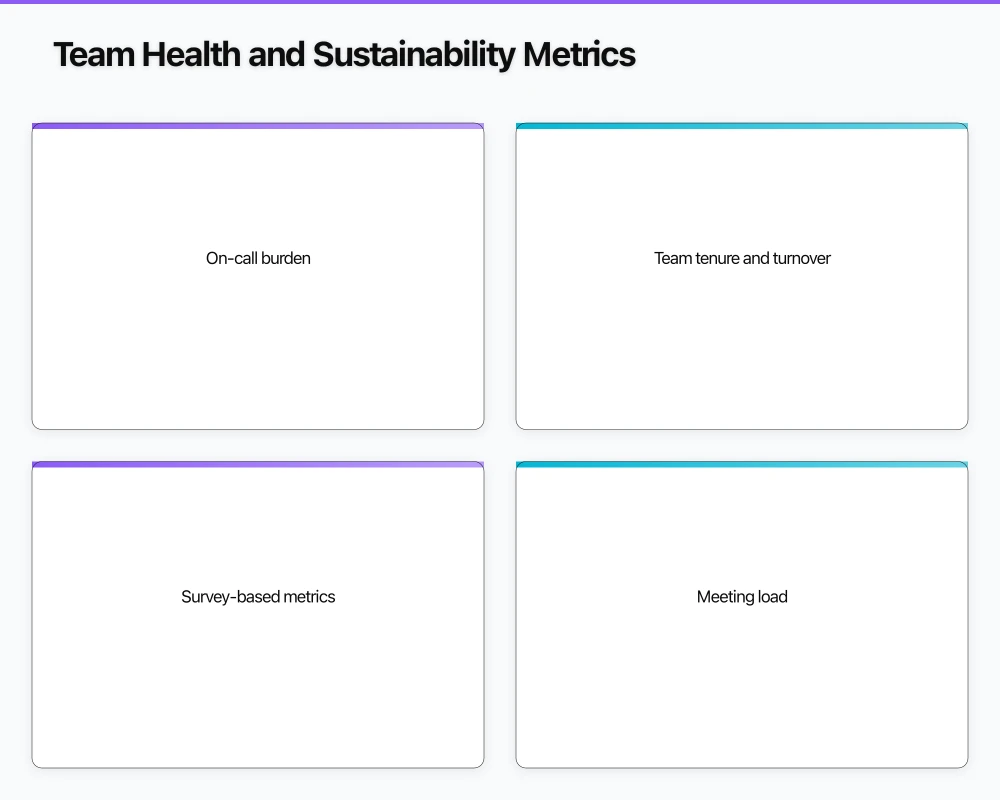
Team tenure and turnover provide leading indicators for knowledge retention and team effectiveness. While some turnover is healthy, rates exceeding 15% annually in senior roles typically indicate systemic issues. More importantly, track tenure distribution—teams entirely composed of developers with under two years at the company lack institutional knowledge, while teams with no new members risk stagnation. Aim for a balanced distribution.
Survey-based metrics capture subjective but crucial team health factors. Regular pulse surveys should assess psychological safety (do team members feel safe taking risks and raising concerns), role clarity (do developers understand expectations and priorities), and learning opportunity (are developers developing new skills). Google’s Project Aristotle research demonstrated that psychological safety was the strongest predictor of team performance, exceeding the impact of individual capability.
Meeting load affects developer productivity but also signals organizational health. Engineering teams averaging more than 15 hours of meetings per week show significantly reduced output and higher frustration in developer surveys. Track both total meeting time and fragmentation—a calendar with four 30-minute meetings is more disruptive than a single 2-hour block. Paul Graham’s “Maker’s Schedule, Manager’s Schedule” essay remains relevant: developers require extended uninterrupted blocks for complex problem-solving.
The critical insight from Atlassian’s Team Playbook research is that team health metrics are not secondary to delivery metrics—they’re predictive. Teams scoring high on health metrics sustain performance over time, while teams showing delivery success alongside poor health metrics experience regression to mean within 6-12 months as burnout, knowledge loss, and technical debt compound.
Avoiding Vanity Metrics and Building a Metrics Strategy
The path from measurement to meaningful improvement requires distinguishing between vanity metrics that create false confidence and actionable metrics that drive strategic decisions. CFO and business leadership naturally gravitate toward simple productivity ratios, creating pressure to measure what’s measurable rather than what’s meaningful.
Lines of code remains the canonical vanity metric—easy to measure, superficially objective, and completely misleading. Research consistently shows that experienced developers produce less code than junior developers for equivalent functionality, as they reuse components, eliminate unnecessary complexity, and design cleaner abstractions. Measuring and incentivizing code volume actively works against code quality and maintainability.
Similarly, commit counts and story points completed measure activity without assessing value. A developer making 50 commits to refactor a component may deliver more business value than 5 commits implementing features, but simple activity metrics can’t distinguish between them. Story points become gamed metrics once tied to performance reviews—teams inflate estimates to meet targets while actual delivery remains unchanged.
Code coverage serves as a cautionary example of how good metrics become vanity metrics when misapplied. Code coverage above 80% correlates with fewer production defects, making it useful as a codebase health indicator. However, setting coverage targets leads to testing theater—developers write assertions that execute code without validating behavior, achieving 100% coverage while missing critical edge cases. Focus instead on coverage trends and whether complex, critical paths have thorough testing.
Building an effective metrics strategy requires balancing outcome metrics (DORA metrics, business KPIs), productivity metrics (cycle time, developer experience), and health metrics (on-call burden, team satisfaction). No single metric tells the complete story—elite engineering organizations use dashboards combining 8-12 carefully selected metrics reviewed regularly.
Implement metrics incrementally rather than attempting comprehensive measurement immediately. Start with deployment frequency and lead time if you have mature CI/CD, or focus on cycle time and review velocity if deployment automation remains nascent. Add complexity only when earlier metrics are consistently measured and actively informing decisions.
Transparency principles matter significantly. Metrics used for team-level improvement should be visible to those teams but not used for individual performance assessment. GitHub’s internal metrics philosophy distinguishes between team health metrics (shared broadly), organizational metrics (leadership visibility), and individual metrics (private to the developer). This separation prevents metrics gaming while maintaining accountability.
The critical distinction is whether metrics inform learning or drive judgment. Teams that review metrics to identify bottlenecks, experiment with improvements, and validate results create continuous improvement cultures. Organizations that use metrics primarily for performance evaluation create compliance cultures where teams optimize for measurement rather than outcomes.
Strategic Recommendations for Engineering Metrics Implementation
Implementing meaningful metrics across enterprise engineering organizations requires technical instrumentation, cultural change management, and executive commitment to sustained improvement over quick fixes.
Start with infrastructure assessment. Effective metrics require data pipelines from source control, CI/CD systems, incident management, and project tracking tools. Survey your current capability: Can you reliably measure time from commit to production? Can you identify which deployments caused incidents? Can you track cycle time across workflow stages? Missing instrumentation is common—address data collection before building dashboards.
Establish baseline performance across your chosen metrics before setting improvement targets. Six months of baseline data reveals patterns, seasonality, and normal variation. Many organizations set aspirational targets without understanding current performance, creating demoralization when gaps prove larger than expected. Document baseline performance, share transparently with engineering teams, and identify improvement opportunities collaboratively.
Create feedback loops where metrics inform team retrospectives and process improvements. Monthly metrics reviews should ask “What patterns do we observe?” and “What experiments could improve these metrics?” rather than “Who is underperforming?” Microsoft’s internal research on engineering metrics found that teams using metrics for learning improved twice as fast as teams using identical metrics for performance management.
Balance leading and lagging indicators. DORA metrics are lagging—they tell you about past performance but don’t predict future issues. Complement them with leading indicators: increasing test suite runtime predicts slower deployment frequency, rising PR review backlog predicts longer lead times, climbing on-call frequency predicts burnout and turnover. Act on leading indicators before lagging metrics deteriorate.
Align metrics with business outcomes by connecting engineering performance to revenue, customer acquisition, retention, or operational efficiency. This translation is crucial for securing investment in platform improvements. When Etsy reduced deployment lead time from 4 hours to 30 minutes, they documented a 12% increase in feature deployment velocity and correlated it to accelerated A/B testing cycles that improved conversion rates. Business metrics justify engineering metrics.
The architectural implications of metrics strategy deserve explicit attention. Organizations serious about DORA metrics inevitably invest in deployment automation, feature flags, observability infrastructure, and architectural patterns enabling independent service deployment. Measurement and improvement are inseparable—instrumentation reveals opportunities, but capturing them requires platform investment.
The Competitive Advantage of Strategic Measurement
Engineering metrics represent more than operational dashboards—they reflect organizational maturity in treating software delivery as a strategic capability rather than a cost center. The difference between elite and low performers in the 2023 DORA research shows a 973x variance in lead time and 6,570x variance in time to restore service. These aren’t marginal improvements; they represent fundamentally different approaches to building and operating software.
The metrics you choose shape the engineering culture you create. Organizations measuring story points create cultures optimizing for activity. Organizations measuring deployment frequency create cultures optimizing for continuous delivery. Organizations measuring team health create cultures valuing sustainability. These cultural differences compound over years, creating competitive moats that persist even as individual developers change.
For CTOs navigating the complexity of enterprise-scale engineering organizations in 2024, the strategic question isn’t whether to measure, but what measurement strategy best serves your competitive positioning. Are you optimizing for innovation velocity in a rapidly evolving market? Focus on deployment frequency and lead time. Are you operating in a regulated industry where reliability is paramount? Emphasize change failure rate and time to restore service. Are you scaling rapidly and facing retention challenges? Prioritize team health and developer experience metrics.
The organizations that will lead in 2025 and beyond are those treating metrics as strategic tools for continuous improvement rather than compliance artifacts. They measure what matters, act on what they measure, and create cultures where engineering excellence drives business outcomes. The starting point is choosing metrics that reflect the outcomes you actually value—and having the discipline to ignore everything else.
Building high-performing engineering organizations requires more than measurement—it requires strategic platform investment and cultural transformation. Explore how enterprise technology leaders are rethinking engineering effectiveness.
For the practitioner’s view on web design and digital marketing, explore Cosmos Web Tech — where strategy meets execution.
My consultancy Ganda Tech Services operates three specialist divisions covering cloud infrastructure, web development, and mobile apps for Australian businesses.
About the Author
Ashish Ganda is the founder of Ganda Tech Services, a Sydney-based technology consultancy specialising in cloud infrastructure, web development, and mobile app solutions for Australian businesses.
Digital Transformation Roadmap 2026
A 12-month framework for Australian SMBs ready to modernise — phases, tools, and milestones.