CI/CD Pipeline Architecture: From Development to Production in Minutes Not Hours
The Deployment Velocity Gap
The 2023 DORA State of DevOps report confirmed what high-performing teams already knew: elite engineering organisations deploy on demand, multiple times per day, with lead times measured in hours rather than weeks. The gap between elite and low performers isn’t narrowing—it’s widening.
This gap matters beyond engineering metrics. Deployment velocity correlates with business outcomes: faster feature delivery, quicker bug fixes, more experimentation, better competitive responsiveness. Organisations that deploy weekly can’t compete with those that deploy hourly.
Yet most enterprise CI/CD pipelines operate in the 30-minute to 2-hour range. Developers push code, wait, context-switch to other work, get the result notification, re-establish context, and iterate. Each slow cycle compounds into days of lost productivity.
The path to minute-scale deployments isn’t about choosing different tools. It’s about architectural decisions that eliminate bottlenecks, parallelise work, and make speed the default rather than the exception.
Anatomy of a Fast Pipeline
A well-architected CI/CD pipeline has five phases, each optimised for speed while maintaining quality gates:
[Push] -> [Verify] -> [Build] -> [Test] -> [Deploy]
  |          |           |          |          |
  v          v           v          v          v
 under 1s       under 30s        under 60s      under 180s      under 120s
           Lint        Compile     Unit     Canary
           Format      Package   Integration  Promote
           Secrets     Sign       Contract   Rollback
Total pipeline time: under 7 minutes. This isn’t theoretical—production pipelines at scale regularly achieve this.
Let’s examine each phase.
Phase 1: Verify (Target: <30 seconds)
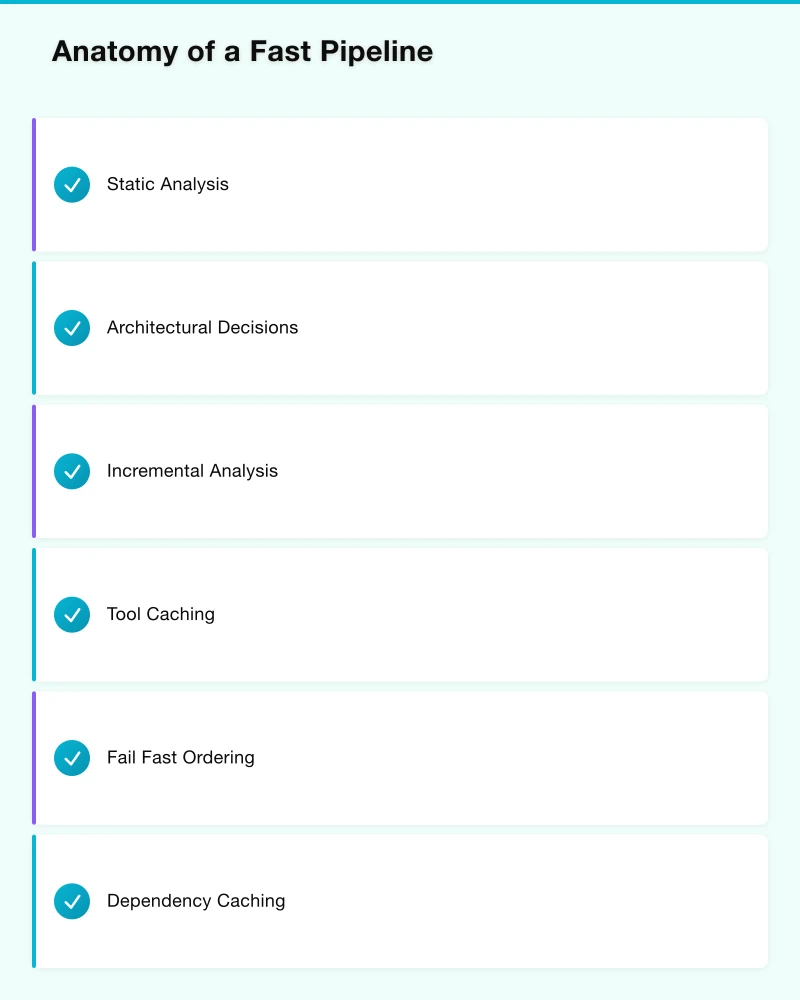
Verification catches obvious problems before expensive operations:
Static Analysis
- Linting: Style conformance, basic bug detection
- Formatting: Consistent code style
- Secret detection: Prevent credential commits
- Dependency audit: Known vulnerability check
These operations should run in parallel on cached tool installations. Pre-commit hooks catch issues before push, but pipeline verification ensures nothing slips through.
Architectural Decisions:
Incremental Analysis Only analyse changed files. Full repository scans are for scheduled jobs, not PR pipelines.
Tool Caching Cache linting tools, formatters, and their configurations. Downloading tools on every run adds 10-30 seconds of pure waste.
Fail Fast Ordering Run the fastest checks first. If formatting fails in 2 seconds, don’t wait for the 15-second security scan to complete before reporting.
Phase 2: Build (Target: <60 seconds)
Build time is where most pipelines bleed minutes. Compiling code, resolving dependencies, packaging artefacts—each step has optimisation opportunities.
Dependency Caching
Every CI/CD platform supports dependency caching. Yet many pipelines don’t use it effectively:
# Bad: Generic cache key
cache:
  key: dependencies
  paths:
    - node_modules/

# Good: Content-addressed cache
cache:
  key: ${CI_COMMIT_REF_SLUG}-${hash(package-lock.json)}
  paths:
    - node_modules/
Content-addressed caching ensures cache hits when dependencies haven’t changed and cache misses when they have—no stale dependencies, no unnecessary downloads.
Incremental Builds
Modern build systems (Bazel, Gradle, Turborepo, Nx) support incremental builds that skip unchanged components:
[Monorepo with 50 services]
                |
                v
[Change detection: 3 services affected]
                |
                v
[Build only 3 services: 45 seconds]
(vs. full build: 12 minutes)
The architectural requirement: properly declared dependencies between components. Without explicit dependency graphs, build systems can’t determine what’s safe to skip.
Parallel Builds
For independent components, build in parallel:
build:
  parallel:
    matrix:
      - SERVICE: [auth, users, payments, notifications]
  script:
    - make build-$SERVICE
Parallelisation is limited by available compute. Cloud-native CI/CD platforms (GitHub Actions, GitLab, CircleCI) scale runners dynamically—use this capability rather than waiting on shared runners.
Container Build Optimisation
Docker builds are often the slowest pipeline stage. Optimise through:
Multi-stage builds: Separate build dependencies from runtime image Layer ordering: Least-changing layers first, most-changing last BuildKit caching: Enable experimental caching for massive speedups Base image strategy: Small, standardised base images reduce pull and build time
# Optimised Dockerfile structure
FROM node:20-alpine AS deps
WORKDIR /app
COPY package*.json ./
RUN npm ci --only=production
FROM node:20-alpine AS build
WORKDIR /app
COPY --from=deps /app/node_modules ./node_modules
COPY . .
RUN npm run build
FROM node:20-alpine
WORKDIR /app
COPY --from=deps /app/node_modules ./node_modules
COPY --from=build /app/dist ./dist
CMD ["node", "dist/main.js"]Phase 3: Test (Target: <180 seconds)
Testing is where speed and quality appear to conflict. They don’t—but achieving both requires architectural investment.
Test Pyramid Enforcement
The test pyramid isn’t just a diagram—it’s an architectural principle:
           /\
          /  \       E2E: under 10% (expensive, slow)
         /----\
        /      \     Integration: ~20% (moderate)
       /--------\
      /          \   Unit: ~70% (cheap, fast)
     /____________\
When integration tests dominate (the “ice cream cone” anti-pattern), pipelines become slow and brittle. Enforce the pyramid through:
- Code coverage requirements focused on unit tests
- Integration test budgets (maximum count/duration)
- E2E tests reserved for critical user journeys
Test Parallelisation
Tests that don’t share state can run in parallel:
test:
  parallel: 4
  script:
    - pytest --splits 4 --group $CI_NODE_INDEX tests/
Test splitting works best with balanced splits—avoid scenarios where one runner gets all slow tests while others idle.
Test Selection
Run the right tests for each change:
Path-based selection: Changes to /services/auth run auth tests
Impact analysis: Static analysis determines affected tests
Flaky test quarantine: Known-flaky tests run separately, don’t block deployment
# Test selection based on changed files
test:
  rules:
    - changes:
        - "services/auth/**/*"
      script: pytest tests/auth/
    - changes:
        - "services/payments/**/*"
      script: pytest tests/payments/
Contract Testing
Replace many integration tests with contract tests that verify service interfaces without running full service stacks:
- Pact, Spring Cloud Contract for HTTP APIs
- AsyncAPI for message-based systems
- Provider verification runs against contract specifications
Contract tests run in milliseconds; integration tests run in seconds or minutes.
Phase 4: Deploy (Target: <120 seconds)
Deployment should be boring—predictable, automated, reversible.
Progressive Delivery
Don’t deploy to 100% of production immediately:
[Canary: 1%] -> [Wait: 5min] -> [Expand: 10%] -> [Wait: 5min] -> [Full: 100%]
      |               |               |
      v               v               v
   Metrics OK?    Errors low?    Latency normal?
Canary deployments catch problems before they affect all users. Automated rollback triggers when health checks fail.
Feature Flags
Separate deployment from release:
if (featureFlags.isEnabled('new-checkout-flow', user)) {
  return renderNewCheckout();
} else {
  return renderLegacyCheckout();
}
This enables:
- Deploying incomplete features safely
- Gradual rollout to user segments
- Instant rollback without redeploy
- A/B testing within production
Blue-Green Deployments
Maintain two identical production environments:
Load Balancer
      |
      +----> Blue (current production)
      |
      +----> Green (new version, warming up)
Deploy to green, verify health, switch traffic. If problems emerge, switch back instantly.
Infrastructure as Code
Every deployment should be reproducible from code:
- Terraform, Pulumi for cloud infrastructure
- Kubernetes manifests in version control
- Environment configuration in secrets management
- No manual changes to production
Pipeline Architecture Patterns
Pattern 1: Trunk-Based Development
Long-lived feature branches are pipeline killers. They diverge from main, require complex merges, and delay integration until the worst possible moment.
Trunk-based development keeps branches short-lived:
- Feature branches last hours to days, not weeks
- Continuous integration to main branch
- Feature flags protect incomplete work
- Small, frequent merges reduce integration risk
Pipeline implications:
- Every commit to main is deployable
- No separate “release” branches to maintain
- Fewer merge conflicts, faster feedback
Pattern 2: Monorepo with Build Optimisation
Monorepos centralise code management but require sophisticated build tooling:
/monorepo
  /services
    /auth
    /users
    /payments
  /libraries
    /common-utils
    /database-client
  /infrastructure
    /terraform
    /kubernetes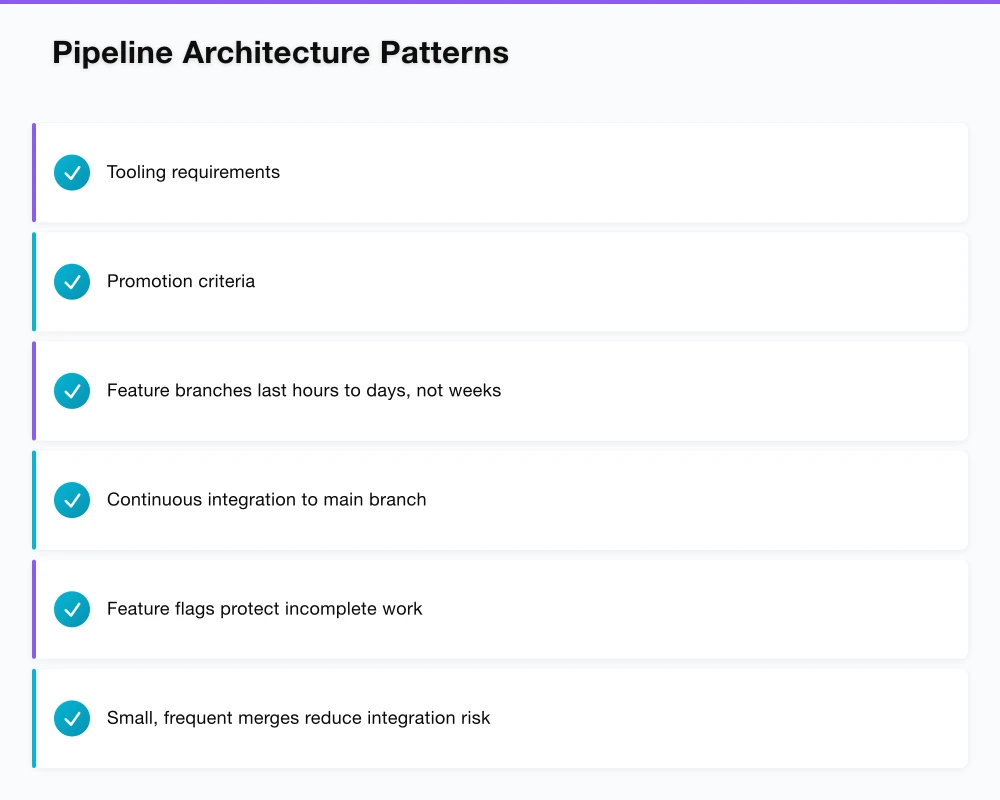
Tooling requirements:
- Bazel, Pants, or Nx for dependency-aware builds
- Affected target detection for test selection
- Distributed build cache for cross-developer speedup
Without proper tooling, monorepo builds become impossibly slow. With proper tooling, they’re faster than polyrepo alternatives due to shared caching.
Pattern 3: Multi-Stage Promotion
Production deployment is the final stage, not the only stage:
[Build] -> [Dev] -> [Staging] -> [Production]
              |          |            |
              v          v            v
         Automated   Automated    Automated
         + Smoke     + Regression + Canary
Each environment uses identical artefacts—same container image, same configuration structure. Only secrets and environment-specific values differ.
Promotion criteria:
- Dev: Build passes, unit tests pass
- Staging: Integration tests pass, performance baseline met
- Production: Smoke tests pass, approval gates cleared
Pattern 4: GitOps for Kubernetes
For Kubernetes-based deployments, GitOps provides a declarative model:
[App Repo] -> [Build] -> [Update Image Tag] -> [Config Repo]
                                                     |
                                                     v
                                            [ArgoCD/Flux]
                                                     |
                                                     v
                                            [Kubernetes Cluster]
Benefits:
- Git is the source of truth for cluster state
- Audit trail through commit history
- Easy rollback by reverting commits
- Consistent deployment process across environments
Measuring Pipeline Performance
You can’t improve what you don’t measure. Track these metrics:
Lead Time Time from commit to production deployment. Elite: <1 hour. Low: >6 months.
Deployment Frequency How often you deploy to production. Elite: On-demand, multiple times per day. Low: Monthly to quarterly.
Mean Time to Recovery (MTTR) How long to restore service after an incident. Elite: <1 hour. Low: >1 week.
Change Failure Rate Percentage of deployments causing failures. Elite: 0-15%. Low: 46-60%.
Instrumentation Approach
Build observability into your pipeline:
# Example: Pipeline metrics in GitLab CI
after_script:
  - |
    curl -X POST "$METRICS_ENDPOINT" \
      -d "pipeline_id=$CI_PIPELINE_ID" \
      -d "job=$CI_JOB_NAME" \
      -d "duration=$CI_JOB_DURATION" \
      -d "status=$CI_JOB_STATUS"
Visualise trends over time. Celebrate improvements. Investigate regressions.
Common Bottlenecks and Solutions
Bottleneck: Shared Test Environments
Problem: Tests queue waiting for environment access. Solution: Ephemeral environments spun up per pipeline, torn down after.
Bottleneck: Flaky Tests
Problem: Random failures require reruns, block deployments. Solution: Quarantine flaky tests, track flake rates, require fixes before unquarantine.
Bottleneck: Manual Approvals
Problem: Deployments wait for human clicks. Solution: Automate approval for low-risk changes. Reserve manual gates for production-breaking risk levels.
Bottleneck: Slow Artefact Transfers
Problem: Moving build artefacts between stages takes minutes. Solution: Use cloud-native artefact storage. Keep artefacts in same region as runners.
Bottleneck: Sequential Everything
Problem: Steps that could parallel run sequentially. Solution: Audit pipeline for parallelisation opportunities. Independent jobs should run concurrently.
Building the Culture
Fast pipelines require more than technical changes:
Make Speed Visible Display pipeline duration on team dashboards. Celebrate when times improve. Investigate when they regress.
Allocate Time for Pipeline Work Pipeline optimisation is infrastructure investment, not optional polish. Budget 10-15% of engineering time for developer experience improvements.
Treat Pipeline as Product Pipeline serves developers as customers. Gather feedback. Iterate on pain points. Measure satisfaction.
Share Ownership Centralised platform teams provide infrastructure; delivery teams own their pipeline configurations. Both contribute to improvements.
The organisations deploying multiple times daily didn’t start there. They invested systematically in pipeline architecture, measured their progress, and made continuous improvement a habit.
That’s the path from hours to minutes. And the organisations that walk it gain competitive advantages that compound over time.
Ash Ganda advises enterprise technology leaders on cloud architecture, DevOps practices, and digital transformation strategy. Connect on LinkedIn for ongoing insights.
Turning strategy into infrastructure? Cloud Geeks covers managed cloud, DevOps, and IT security for businesses putting digital plans into action.
As founder of Ganda Tech Services, I work with Australian businesses to align technology investments with business growth — across cloud, web, and mobile.
About the Author
Ashish Ganda is the founder of Ganda Tech Services, a Sydney-based technology consultancy specialising in cloud infrastructure, web development, and mobile app solutions for Australian businesses.
Digital Transformation Roadmap 2026
A 12-month framework for Australian SMBs ready to modernise — phases, tools, and milestones.