Data Analytics and Business Intelligence: Building a Strategy That Delivers
Introduction
Every enterprise claims to be “data-driven.” Yet the gap between aspiration and reality remains vast. Organisations invest millions in analytics platforms, hire data scientists, and mandate dashboard adoption—only to find business decisions still made on intuition, spreadsheets, and the loudest voice in the room.
I’ve seen this pattern repeatedly: sophisticated technology sitting unused because it doesn’t connect to how decisions actually get made. The technology isn’t the problem. The strategy connecting technology to business outcomes is.
Building effective data analytics and business intelligence capabilities requires understanding that this isn’t primarily a technology challenge. It’s an organisational challenge that technology enables. This perspective shapes everything from architecture decisions to vendor selection to team structure.
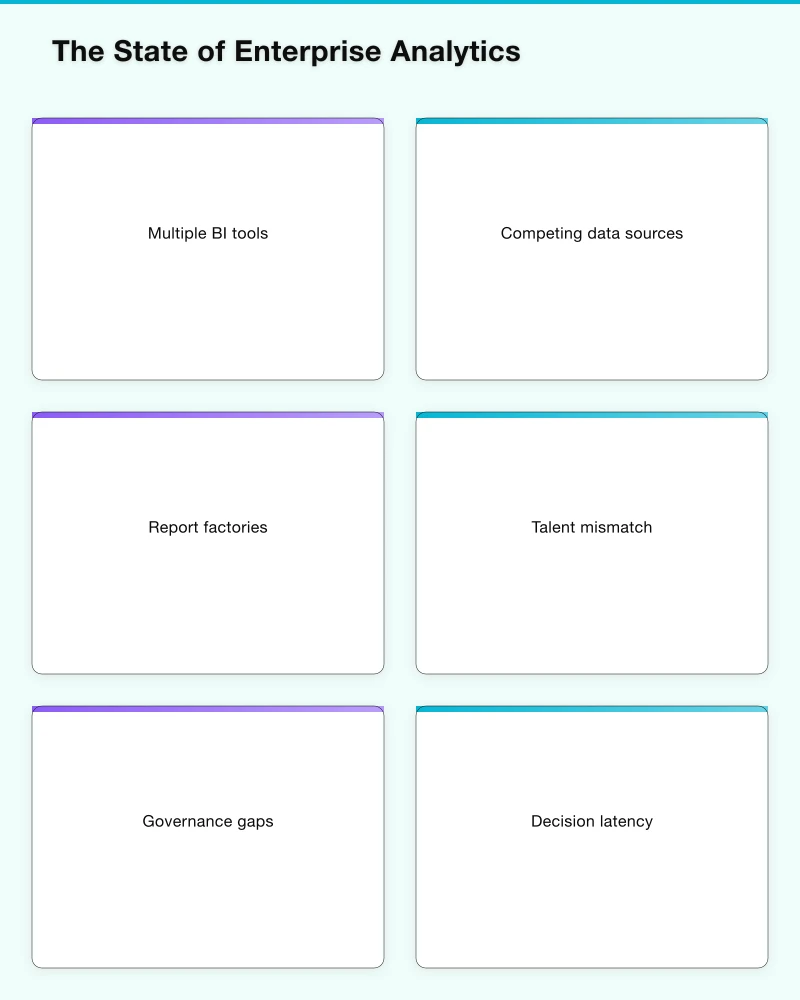
The State of Enterprise Analytics
Where Most Organisations Are
The typical enterprise analytics landscape includes:
Multiple BI tools: Power BI, Tableau, Looker, and various embedded analytics purchased by different departments over years. Each tool has its advocates and its data silos.
Competing data sources: Production databases, data warehouses, data marts, spreadsheets, and shadow IT solutions. “Which number is right?” is a common question in executive meetings.
Report factories: Analytics teams spend most of their time producing recurring reports rather than generating insights. Each stakeholder has their custom report requirements.
Talent mismatch: Data scientists hired to build machine learning models spend their time cleaning data and building dashboards. Business analysts lack SQL skills to self-serve.
Governance gaps: No clear ownership of data definitions. Multiple versions of “customer” or “revenue” exist across the organisation.
This situation evolved naturally over time. Each decision made sense in isolation. The cumulative result is friction that prevents analytics from delivering value.
The Cost of Fragmentation
The real cost isn’t the redundant tool licenses—it’s the opportunity cost:
Decision latency: Getting the data needed for a decision takes days or weeks. By the time analysis is complete, the decision context has changed.
Trust deficit: When different reports show different numbers, stakeholders trust none of them. Decisions revert to intuition with analytics as justification theatre.
Talent frustration: Skilled analysts leave organisations where they can’t do meaningful work. The remaining team focuses on keeping the lights on.
Missed opportunities: Pattern recognition across data sources never happens because the data isn’t integrated. Cross-functional insights remain invisible.
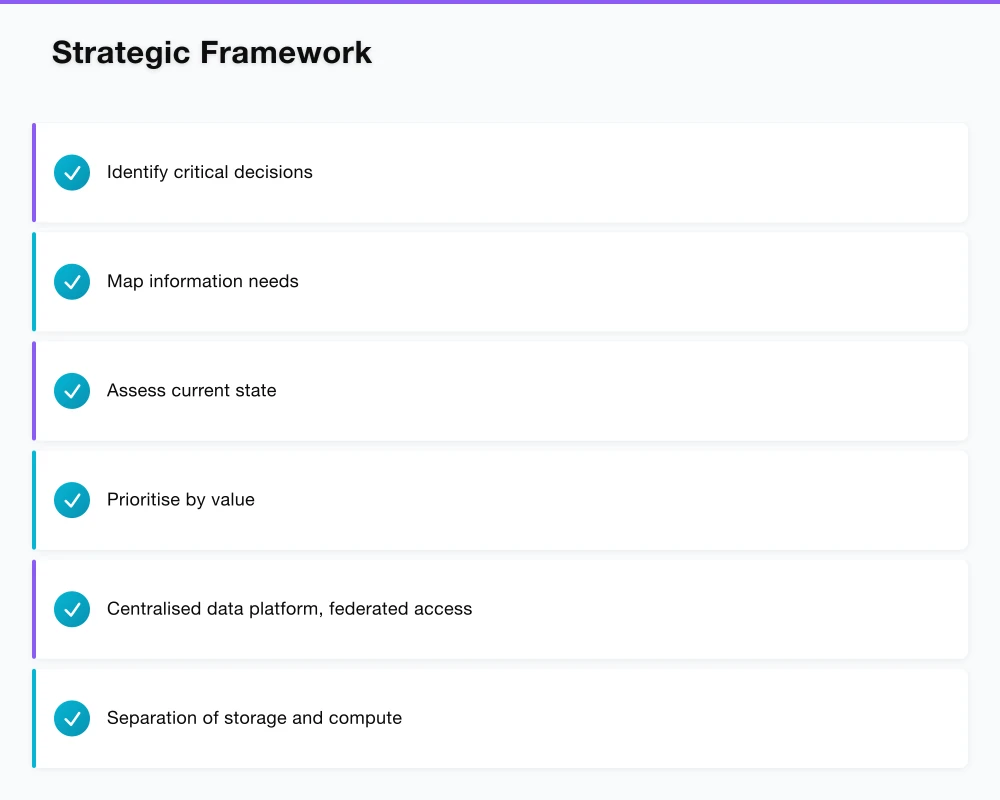
Strategic Framework
Start with Decisions, Not Data
The fundamental mistake in analytics strategy is starting with the data you have rather than the decisions you need to make. This leads to analytics capabilities optimised for data characteristics rather than business value.
Instead, work backwards:
Identify critical decisions: What decisions, if improved, would most impact business outcomes? These aren’t necessarily the decisions executives think about—they’re often operational decisions made thousands of times daily.
Map information needs: What information would improve each decision? What’s the required accuracy, timeliness, and granularity?
Assess current state: How are these decisions made today? What data is used? What’s the gap between current and desired state?
Prioritise by value: Which decisions offer the highest leverage? Where is the gap largest and the improvement most feasible?
This analysis invariably reveals that the most impactful analytics investments aren’t the sophisticated machine learning projects—they’re foundational improvements that enable better routine decisions.
Architecture Principles
Modern analytics architecture has converged on patterns that balance flexibility, governance, and performance:
Centralised data platform, federated access: A single platform manages raw data integration and transformation. Business domains access this platform through governed interfaces, maintaining domain-specific data products.
Separation of storage and compute: Cloud data warehouses (Snowflake, BigQuery, Redshift) have made this the default. It enables cost optimisation and performance scaling independently.
ELT over ETL: Extract-Load-Transform pushes transformation logic to the data warehouse, where it can be versioned, tested, and modified without pipeline changes. dbt has become the standard for this pattern.
Semantic layer: A consistent business logic layer between raw data and consumption ensures that “revenue” means the same thing everywhere. Tools like Looker’s LookML or dbt’s metrics layer address this.
Self-service with guardrails: Enable analysts to explore data within governed boundaries. Pre-built data models and curated datasets reduce the need for deep SQL knowledge while maintaining data quality.
Technology Selection
The BI and analytics tool market is mature, with capable options across price points. Selection should be driven by:
Integration with existing ecosystem: If you’re a Microsoft shop, Power BI’s integration provides significant value. Google Cloud customers benefit from Looker’s native BigQuery integration.
Skill availability: Can you hire people who know this tool? Is training available? Exotic choices create single points of failure.
Embedding requirements: If analytics will be embedded in products or customer-facing applications, evaluate embedded analytics capabilities and pricing models carefully.
Governance capabilities: Enterprise deployments need row-level security, audit logging, and integration with identity management. Consumer-grade tools often lack these.
Total cost of ownership: Per-user pricing models can explode costs as adoption grows. Model true costs at scale, not pilot pricing.
My current recommendations for enterprise deployments:
- Primary BI tool: Power BI or Looker, depending on cloud ecosystem
- Data warehouse: Snowflake or BigQuery, depending on existing cloud footprint
- Transformation: dbt for all transformation logic
- Orchestration: Airflow or Dagster for pipeline orchestration
- Data quality: Great Expectations or Monte Carlo for data quality monitoring
Implementation Roadmap
Phase 1: Foundation (Months 1-3)
Establish data platform team: A dedicated team owns the analytics platform. This isn’t a project team—it’s a permanent product team. Include data engineers, analytics engineers, and a product manager.
Audit existing landscape: Document all BI tools, data sources, and integration patterns. Identify the metrics that matter and their current definitions.
Design target architecture: Based on the principles above, design the target state. Plan for incremental migration, not big-bang replacement.
Implement data warehouse: If not already in place, deploy the cloud data warehouse. Establish naming conventions, access patterns, and security model.
Create first data products: Identify two or three high-value data domains. Build end-to-end data products including ingestion, transformation, and consumption layer.
Phase 2: Expansion (Months 4-9)
Migrate priority workloads: Move the most valuable analytics workloads to the new platform. Focus on replacing the reports that consume the most analyst time or drive the most important decisions.
Build self-service capabilities: Develop governed data marts and documentation that enable business analysts to self-serve. Train analysts on the new tools and patterns.
Establish data governance: Implement data cataloguing, quality monitoring, and lineage tracking. Define ownership for critical data domains.
Measure adoption and value: Track platform usage, report migration progress, and attempt to measure decision improvement. Adjust approach based on feedback.
Phase 3: Optimisation (Months 10-12+)
Retire legacy tools: As workloads migrate, decommission old BI tools and data marts. This is often harder politically than technically.
Advanced analytics enablement: With a solid foundation, advanced analytics becomes feasible. Enable data science workloads on the platform.
Continuous improvement: Analytics platforms are never “done.” Establish processes for ongoing enhancement based on user feedback and changing business needs.
Governance and Organisation
Data Ownership Model
Effective analytics requires clear data ownership. The model that works for most enterprises:
Domain data owners: Business leaders own data generated by their domain. Finance owns financial data, Sales owns CRM data, Operations owns operational data.
Platform team stewardship: The platform team ensures data is accessible, documented, and quality-monitored. They don’t own the data—they enable its use.
Central governance council: Cross-functional body sets policies, resolves disputes, and prioritises platform investments. Includes business and technology representatives.
This federated model balances business ownership with platform efficiency. Avoid both extremes: purely centralised data teams that become bottlenecks, and purely federated approaches that recreate silos.
Roles and Skills
Modern analytics teams need diverse skills:
Data engineers: Build and maintain data pipelines, ensure data quality and availability. Strong SQL and Python skills, understanding of distributed systems.
Analytics engineers: The emerging role bridging data engineering and analysis. Transform raw data into business-ready datasets. dbt experts who understand both technical and business context.
Data analysts: Translate business questions into analysis, build reports and dashboards, support decision-makers. Strong BI tool skills, business domain knowledge.
Data scientists: Build predictive models, find patterns in data, enable advanced use cases. Statistical and machine learning expertise, programming skills.
Analytics product managers: Define roadmap for analytics capabilities, prioritise investments, ensure platform meets business needs. Rare but increasingly valuable.
Change Management
The hardest part of analytics transformation isn’t technology—it’s changing how people work:
Executive sponsorship: Visible commitment from leadership that data-informed decisions are expected. This means executives asking “what does the data say?” and being willing to be proved wrong.
Training and support: Invest in training programs for business users. Provide office hours, documentation, and readily available support during transition.
Quick wins and storytelling: Identify early successes and communicate them widely. Concrete examples of analytics driving better outcomes build momentum.
Patience: Behaviour change takes time. Plan for 12-18 months to shift culture meaningfully. Technology can be deployed faster than habits can change.
Common Pitfalls
The Perfect Data Fallacy
Waiting for perfect data before enabling analytics means waiting forever. Data is never complete, never perfectly clean, never fully documented. Start with good-enough data for the decisions at hand, and improve iteratively.
The goal isn’t perfect data—it’s better decisions than would be made without analytics.
Dashboard Proliferation
Easy dashboard creation leads to dashboard graveyards. Most dashboards are viewed once then forgotten. Implement review processes: dashboards not accessed for 90 days are archived, new dashboards require justification.
Focus on decision support, not reporting. A dashboard should answer a question relevant to a decision, not just display data.
Metrics Without Context
A number without context is meaningless. “Revenue is $10M” means nothing. “Revenue is $10M, up 15% from last year and 5% above plan” is actionable.
Ensure metrics include trend context, target comparison, and relevant benchmarks. Static numbers breed misinterpretation.
Over-Engineering
Enterprise architects love complex solutions. Resist the temptation to build for hypothetical future scale or flexibility. Start simple, add complexity when proven necessary.
A straightforward implementation that delivers value beats an elegant architecture that’s never completed.
Measuring Success
How do you know if your analytics investment is working?
Leading Indicators
- Platform adoption: Active users, query volume, dashboard views
- Self-service ratio: Percentage of analytics workloads created by business users vs. central team
- Request backlog: Size and age of analytics request queue
- Time to insight: How long from question to answer?
Lagging Indicators
- Decision quality: Harder to measure, but track outcomes of data-informed vs. intuition-based decisions over time
- Operational efficiency: Process improvements enabled by better visibility
- Revenue impact: Can you attribute any revenue improvement to analytics-driven decisions?
- Cost reduction: Legacy tool decommissioning, reduced manual reporting effort
Looking Forward
The analytics landscape continues to evolve. Several trends warrant attention:
Modern data stack commoditisation: The components of a modern data stack (warehouse, transformation, orchestration, BI) are increasingly standardised. Competitive advantage comes from how effectively you use these tools, not from proprietary technology choices.
Real-time analytics expansion: As streaming platforms mature, the expectation for real-time insights is growing. Consider how your architecture will support lower-latency use cases.
Augmented analytics: BI tools are incorporating ML-based features: automated insights, natural language queries, anomaly detection. These enhance analyst productivity but don’t replace analytical thinking.
Data mesh concepts: The data mesh approach—treating data as a product, federated by domain—is influencing how organisations structure data teams. Elements of this model apply even without full adoption.
Conclusion
Effective data analytics and business intelligence is fundamentally about enabling better decisions. Technology is necessary but not sufficient. Success requires clarity on which decisions matter, architecture that enables those decisions, governance that ensures trust, and organisational change that embeds analytics into how work gets done.
The organisations that realise value from analytics investments are those that treat analytics as a capability to be built over time, not a project to be completed. They invest in foundations before advanced use cases. They measure success by decision improvement, not platform sophistication.
For CTOs, the challenge is maintaining strategic perspective while managing tactical implementation. The temptation to chase the latest tool or technique is strong. The discipline to build solid foundations is harder but more valuable.
Start with decisions. Build incrementally. Measure outcomes. Adjust based on learning. This isn’t glamorous, but it’s the path to analytics that actually delivers.
Building effective analytics capabilities requires balancing technology, organisation, and strategy. For CTOs leading this journey, success comes from understanding that analytics transformation is ultimately about changing how decisions are made—and that’s a human challenge as much as a technical one.
The strategic frameworks I discuss here come to life through execution. Cloud Geeks covers the practical side of cloud infrastructure and IT management.
As founder of Ganda Tech Services, I work with Australian businesses to align technology investments with business growth — across cloud, web, and mobile.
About the Author
Ashish Ganda is the founder of Ganda Tech Services, a Sydney-based technology consultancy specialising in cloud infrastructure, web development, and mobile app solutions for Australian businesses.
Digital Transformation Roadmap 2026
A 12-month framework for Australian SMBs ready to modernise — phases, tools, and milestones.